
The chill in startup fundraising is having major ripple effects on startup employee compensation.
Startups on Carta collectively raised about $28 billion through the first half of 2023. That was less than half of the total funds raised in the last quarter of 2021.
As their spending capacity declines, startups have had to look for ways to lengthen their runways. Many have turned to headcount reductions: VC-backed startups have shed tens of thousands of workers this year. The renewed focus on cash efficiency has led to minimal salary growth, and equity packages have not expanded as many expected.
At Carta, we believe it’s our responsibility to share the insights that come from an unmatched amount of data about the private market. This compensation report is drawn from more than 280,000 employee records from startups that use Carta Total Compensation. Other metrics in the report, such as those that describe employee movement, derive from the aggregate pool of more than 1 million employees currently working for the 40,000 startups that use Carta to manage their cap tables.
While the majority of the data presented below describes changes to base salaries, for the first time we’ve also charted changes to equity compensation over time.
Download the addendum to this report for additional insights into equity compensation, including metrics for option pool sizes; equity grants for early employees, advisors, and board members; and suggested equity adjustments for 20 key countries.
H1 2023 key takeaways
The pace of hiring has fallen sharply: During the first half of 2022, startups on Carta collectively hired over 314,000 employees. That figure fell to 129,000 during the first half of 2023.
Salaries flatlined to start the year: Carta Total Compensation benchmarks for employee salaries fell 0.3% from November 2022 to May 2023.
Equity packages saw substantial reductions: Over the November 2022 to May 2023 timeframe, average equity grants benchmarks declined 26%.
Labor market
Carta data on employee movement—new hires, departures, and whether those departures were voluntary or involuntary—is drawn from across the more than 40,000 companies on our cap table platform. This provides Carta nearly unmatched visibility into hiring trends across the private market.
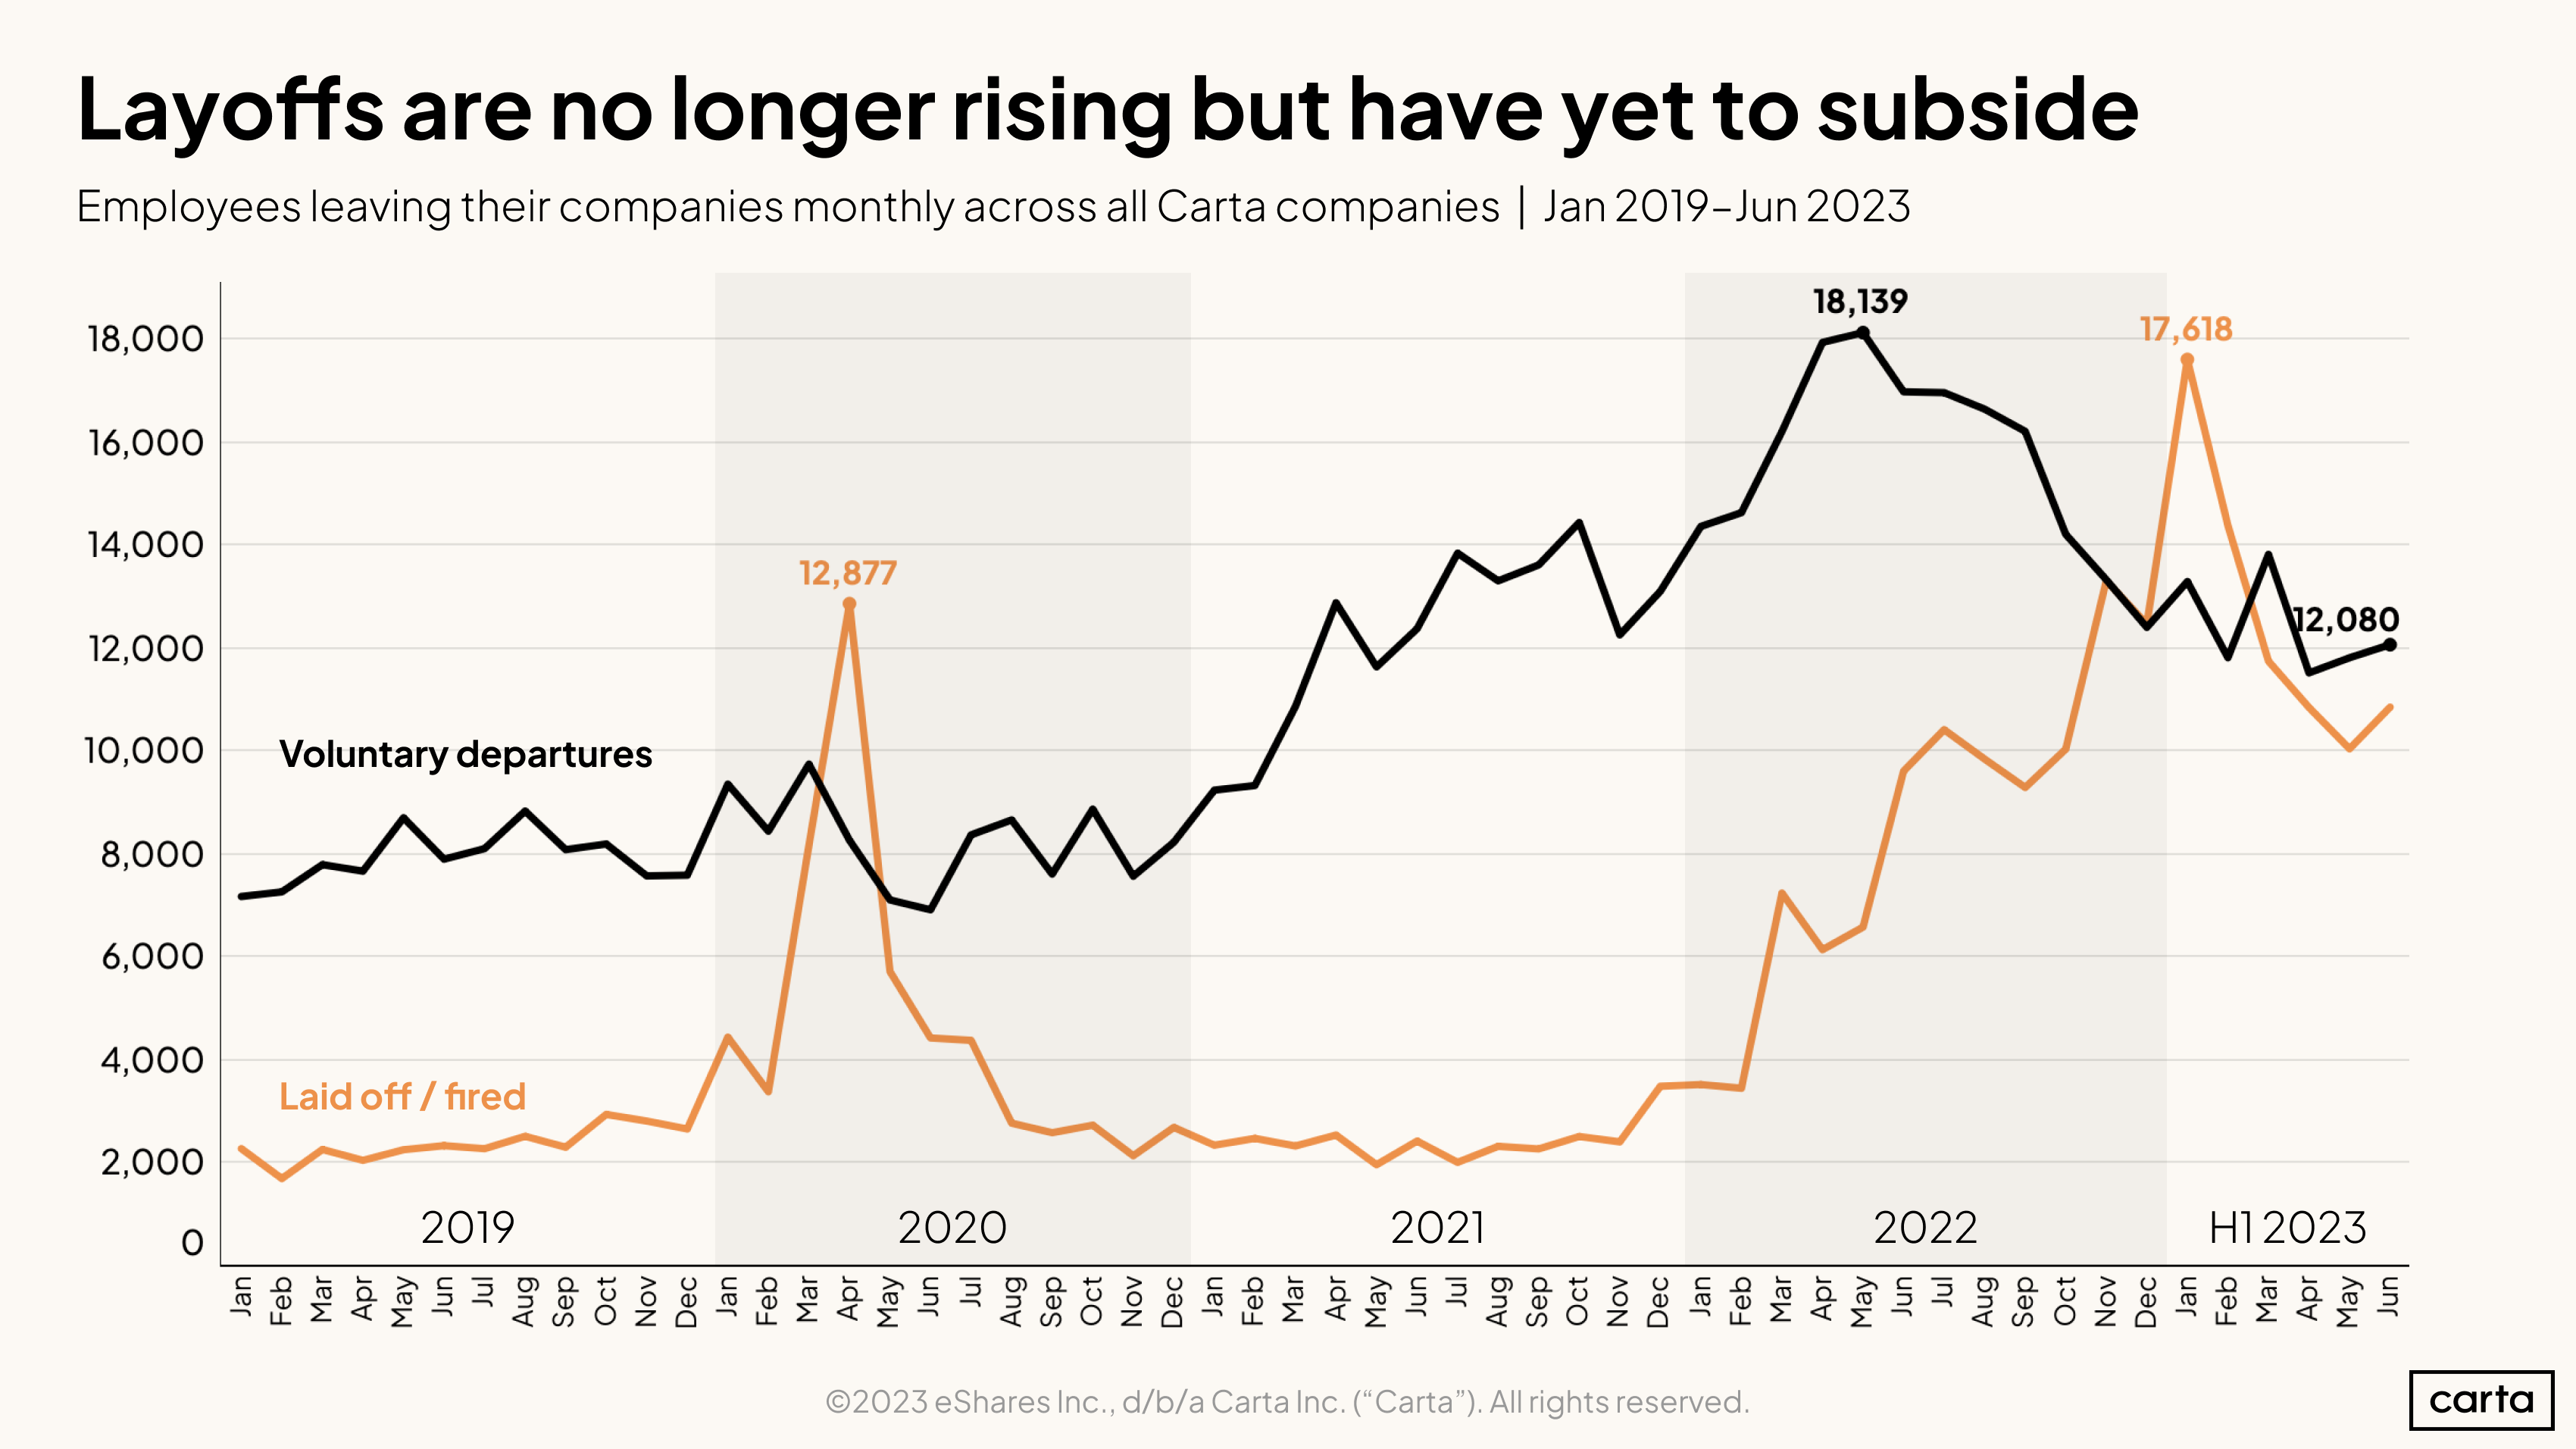
Though headlines about startup layoffs seem to have subsided, tens of thousands of employees are still losing their jobs. Layoffs peaked in January of this year with 17,618 employees impacted in a single month.
Voluntary employee departures have also declined from recent highs. Startup workers deciding to remain in their current positions for longer has likely reduced the need to backfill those roles, adding another drag to startup hiring in 2023.
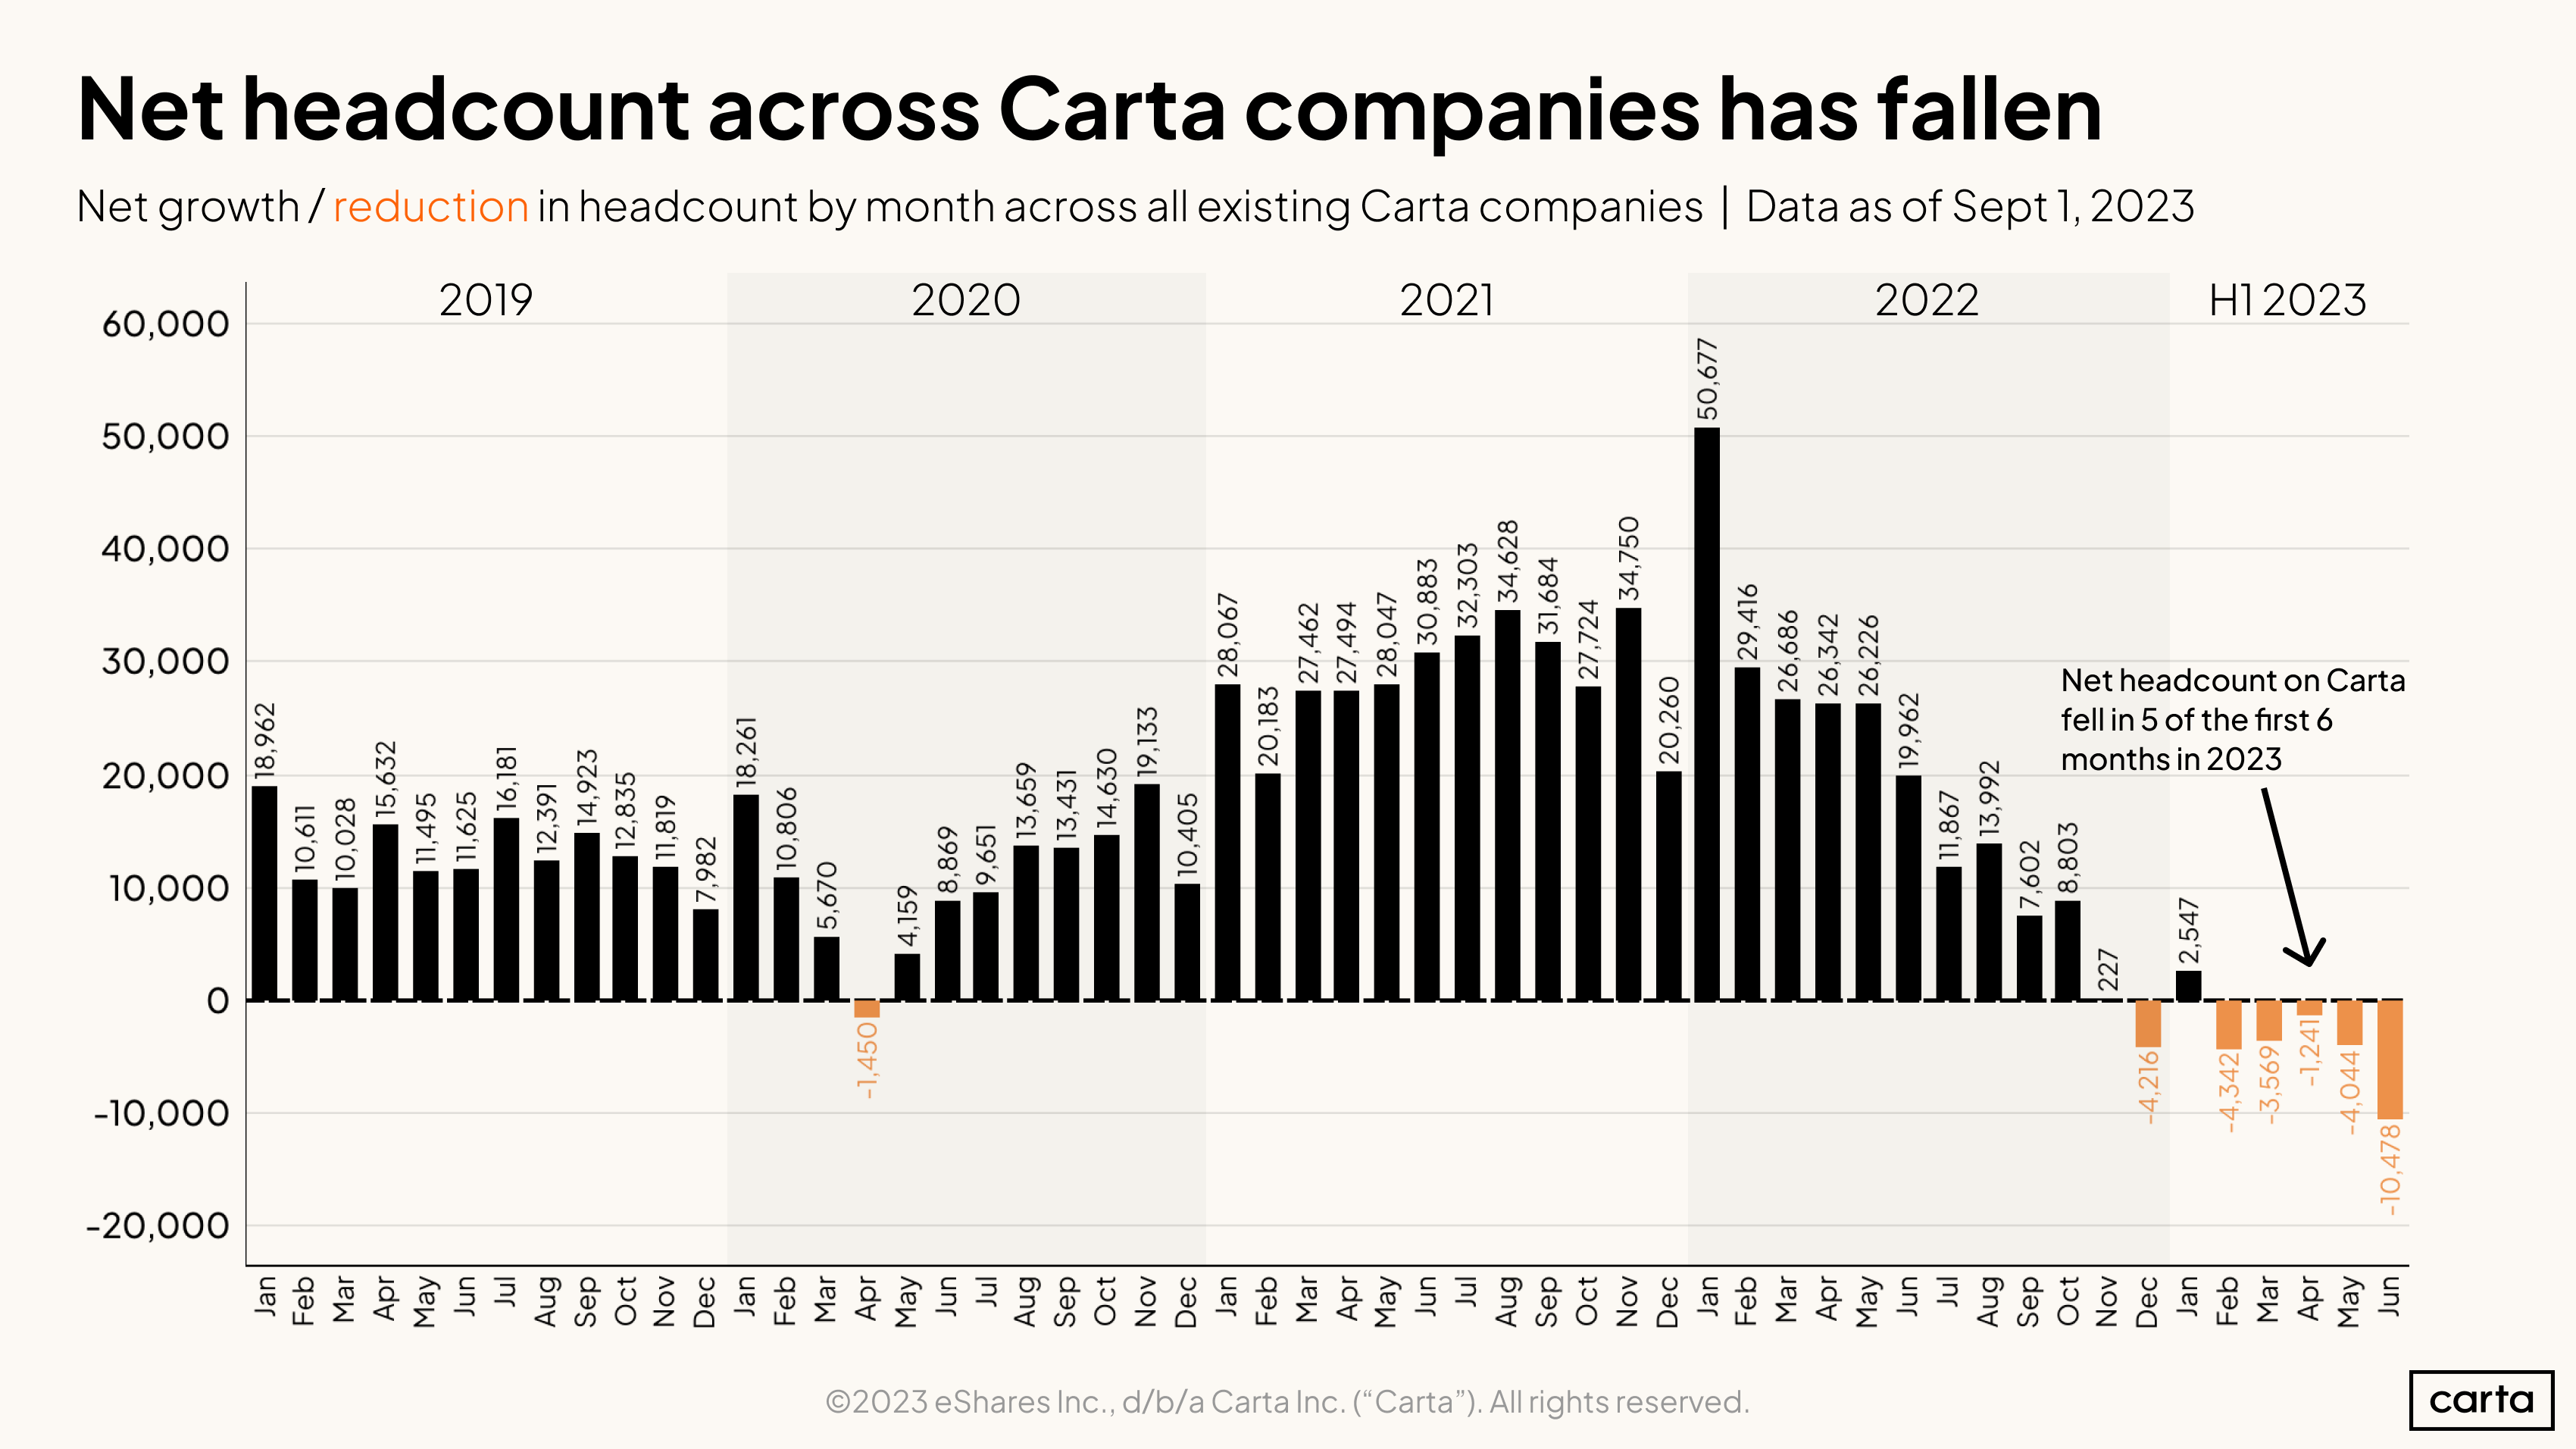
Net headcount across Carta companies has fallen for five straight months (and six of the last seven). The exception—January 2023—is likely due to a cyclical trend: January is usually the strongest month for new hires in any given year.
We expect those orange bars representing negative headcount growth over the past several months to shrink slightly as Carta becomes aware of hires who have already joined—but the trend is unmistakable. The data supports the view that startups have refocused efforts to make do with leaner teams.
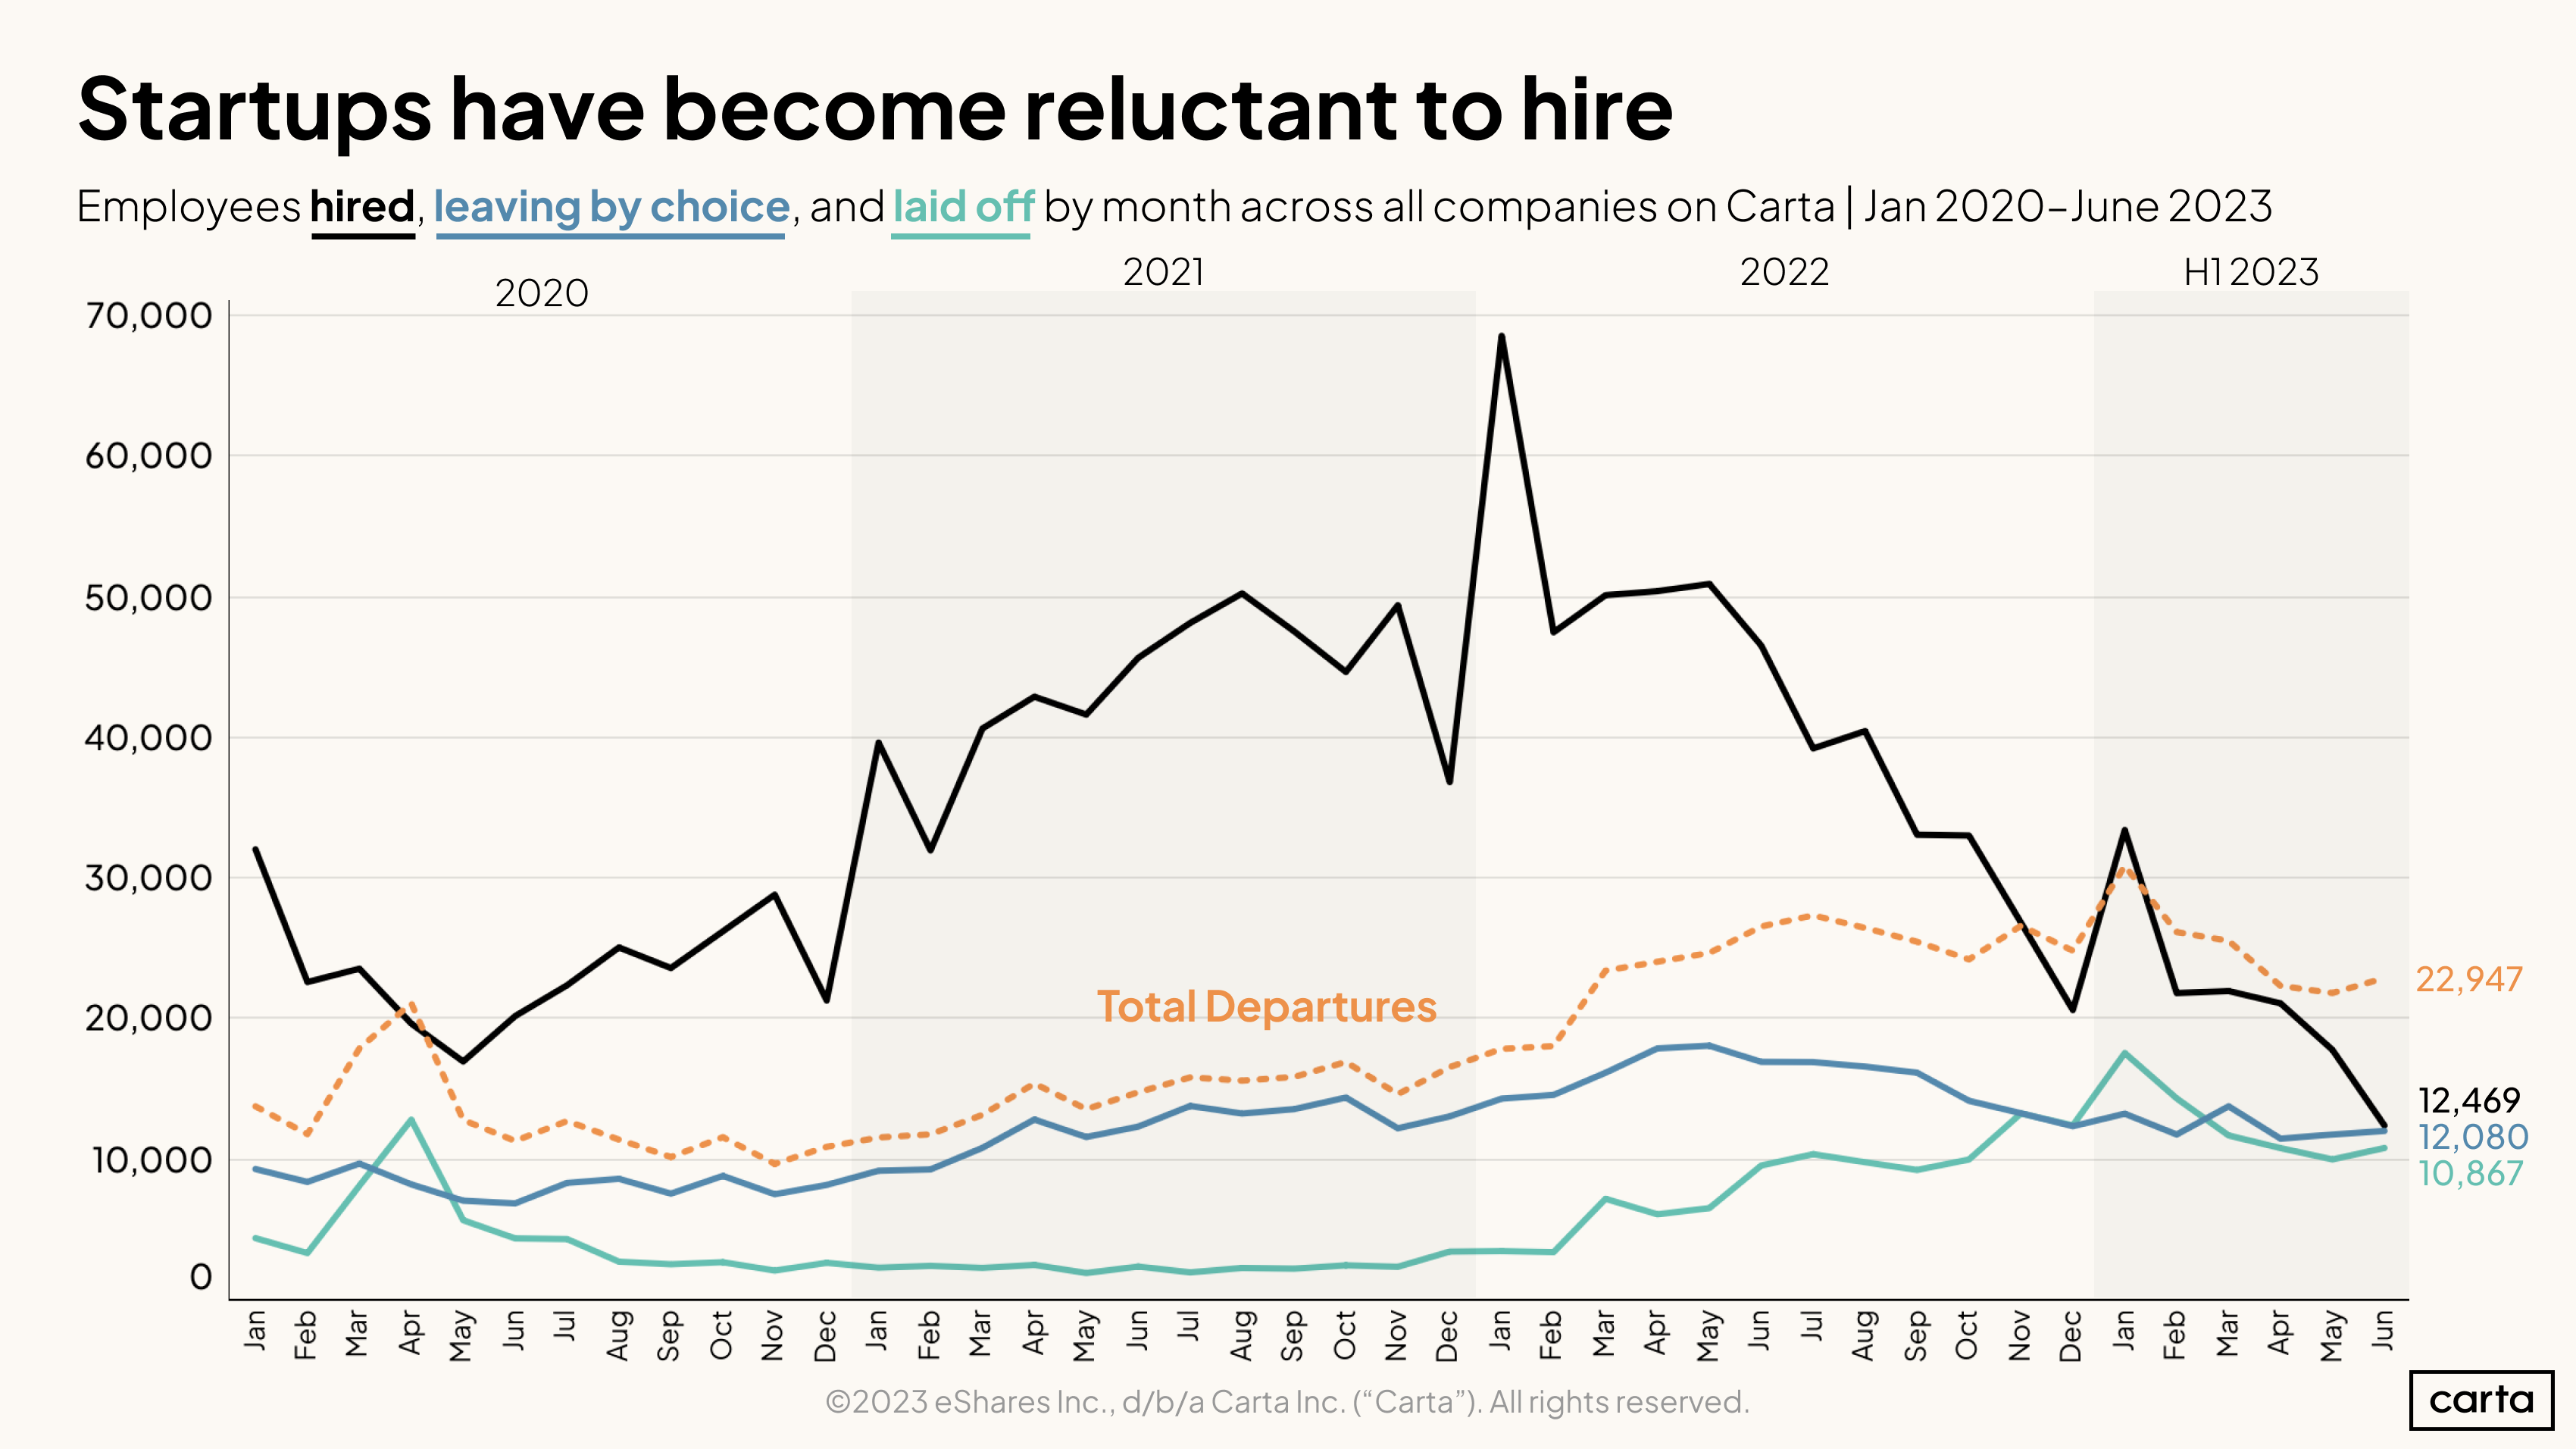
Breaking out the hiring and departure data more granularly, we can see the net headcount declines are a result of decreased hiring by and large. The black line for new hires will likely rise somewhat for May and June once final data arrives, but it is unlikely to rise above the dotted line for total departures.
This decline in hiring is driven primarily by later-stage startups. Funding has been most difficult to come by at the later stages, and valuations there have also seen the sharpest declines.
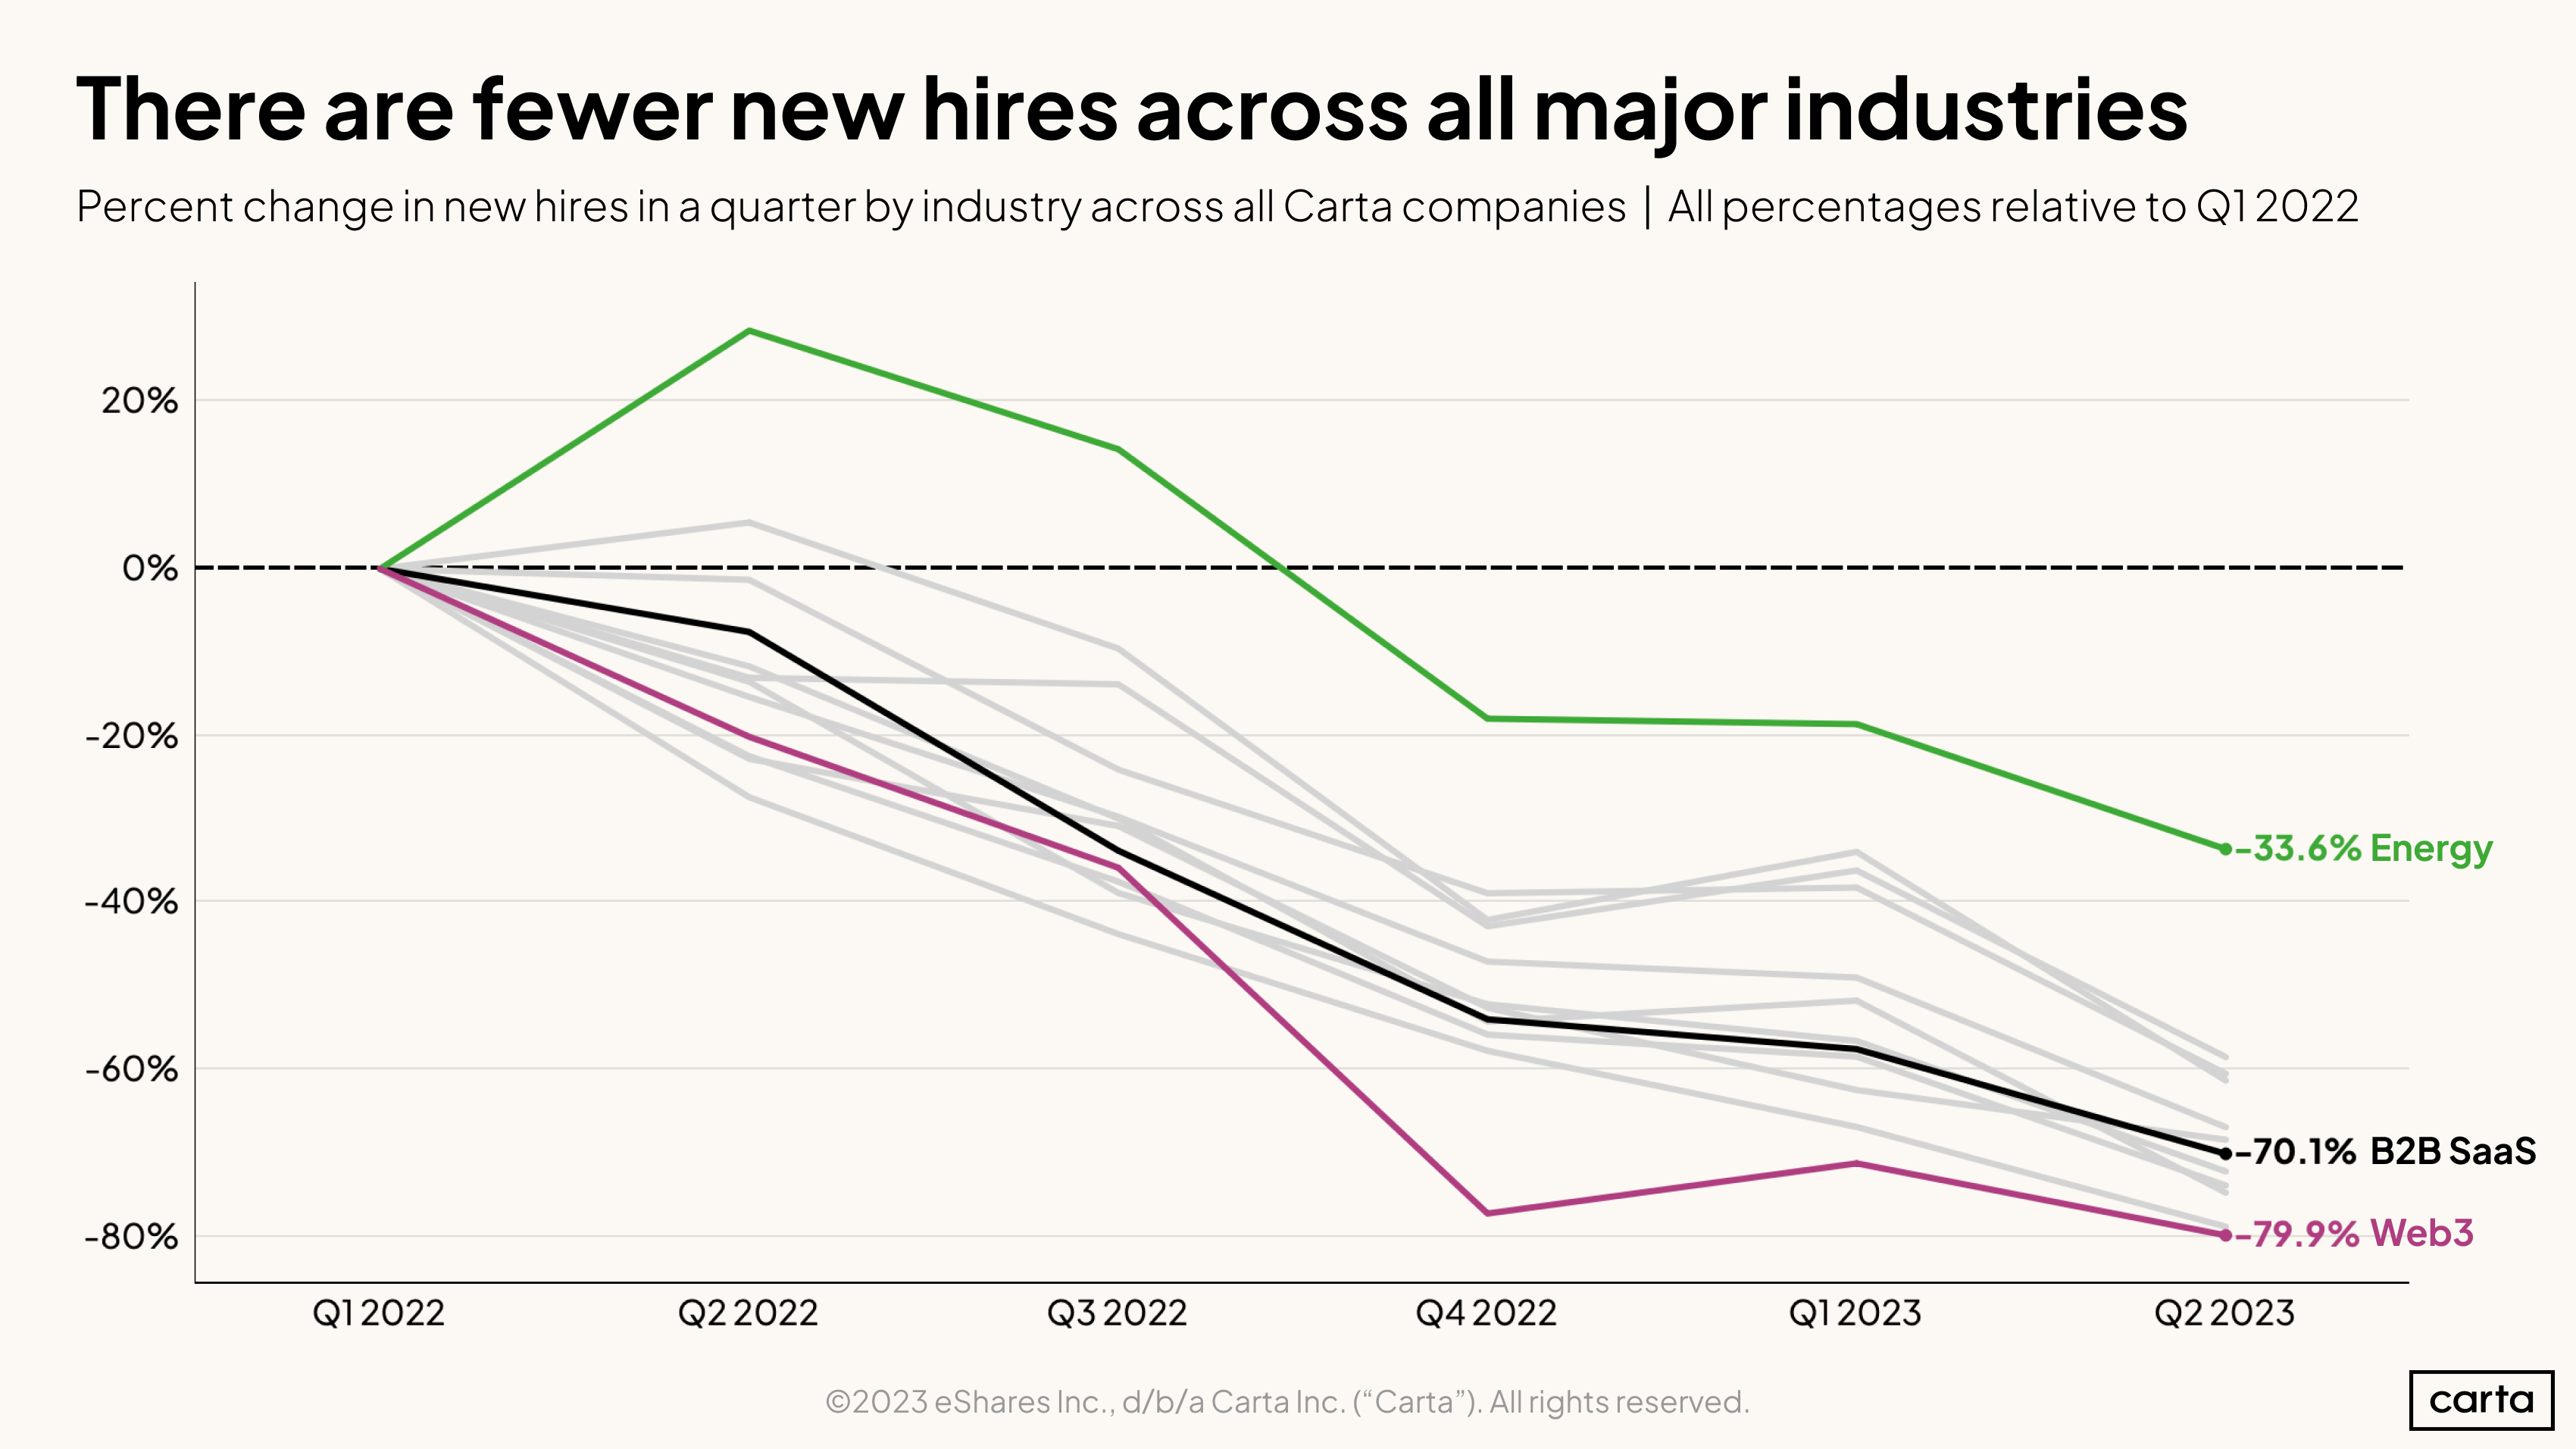
No startup industry bucked the trend of reduced hiring, but energy-sector startups seem to have remained relatively more open to adding new talent. Total hiring in Q2 2023 for energy startups was down 33.6% compared with Q1 2022.
Over the same time period, hiring fell 70% for B2B SaaS companies and nearly 80% in crypto/Web3 companies.
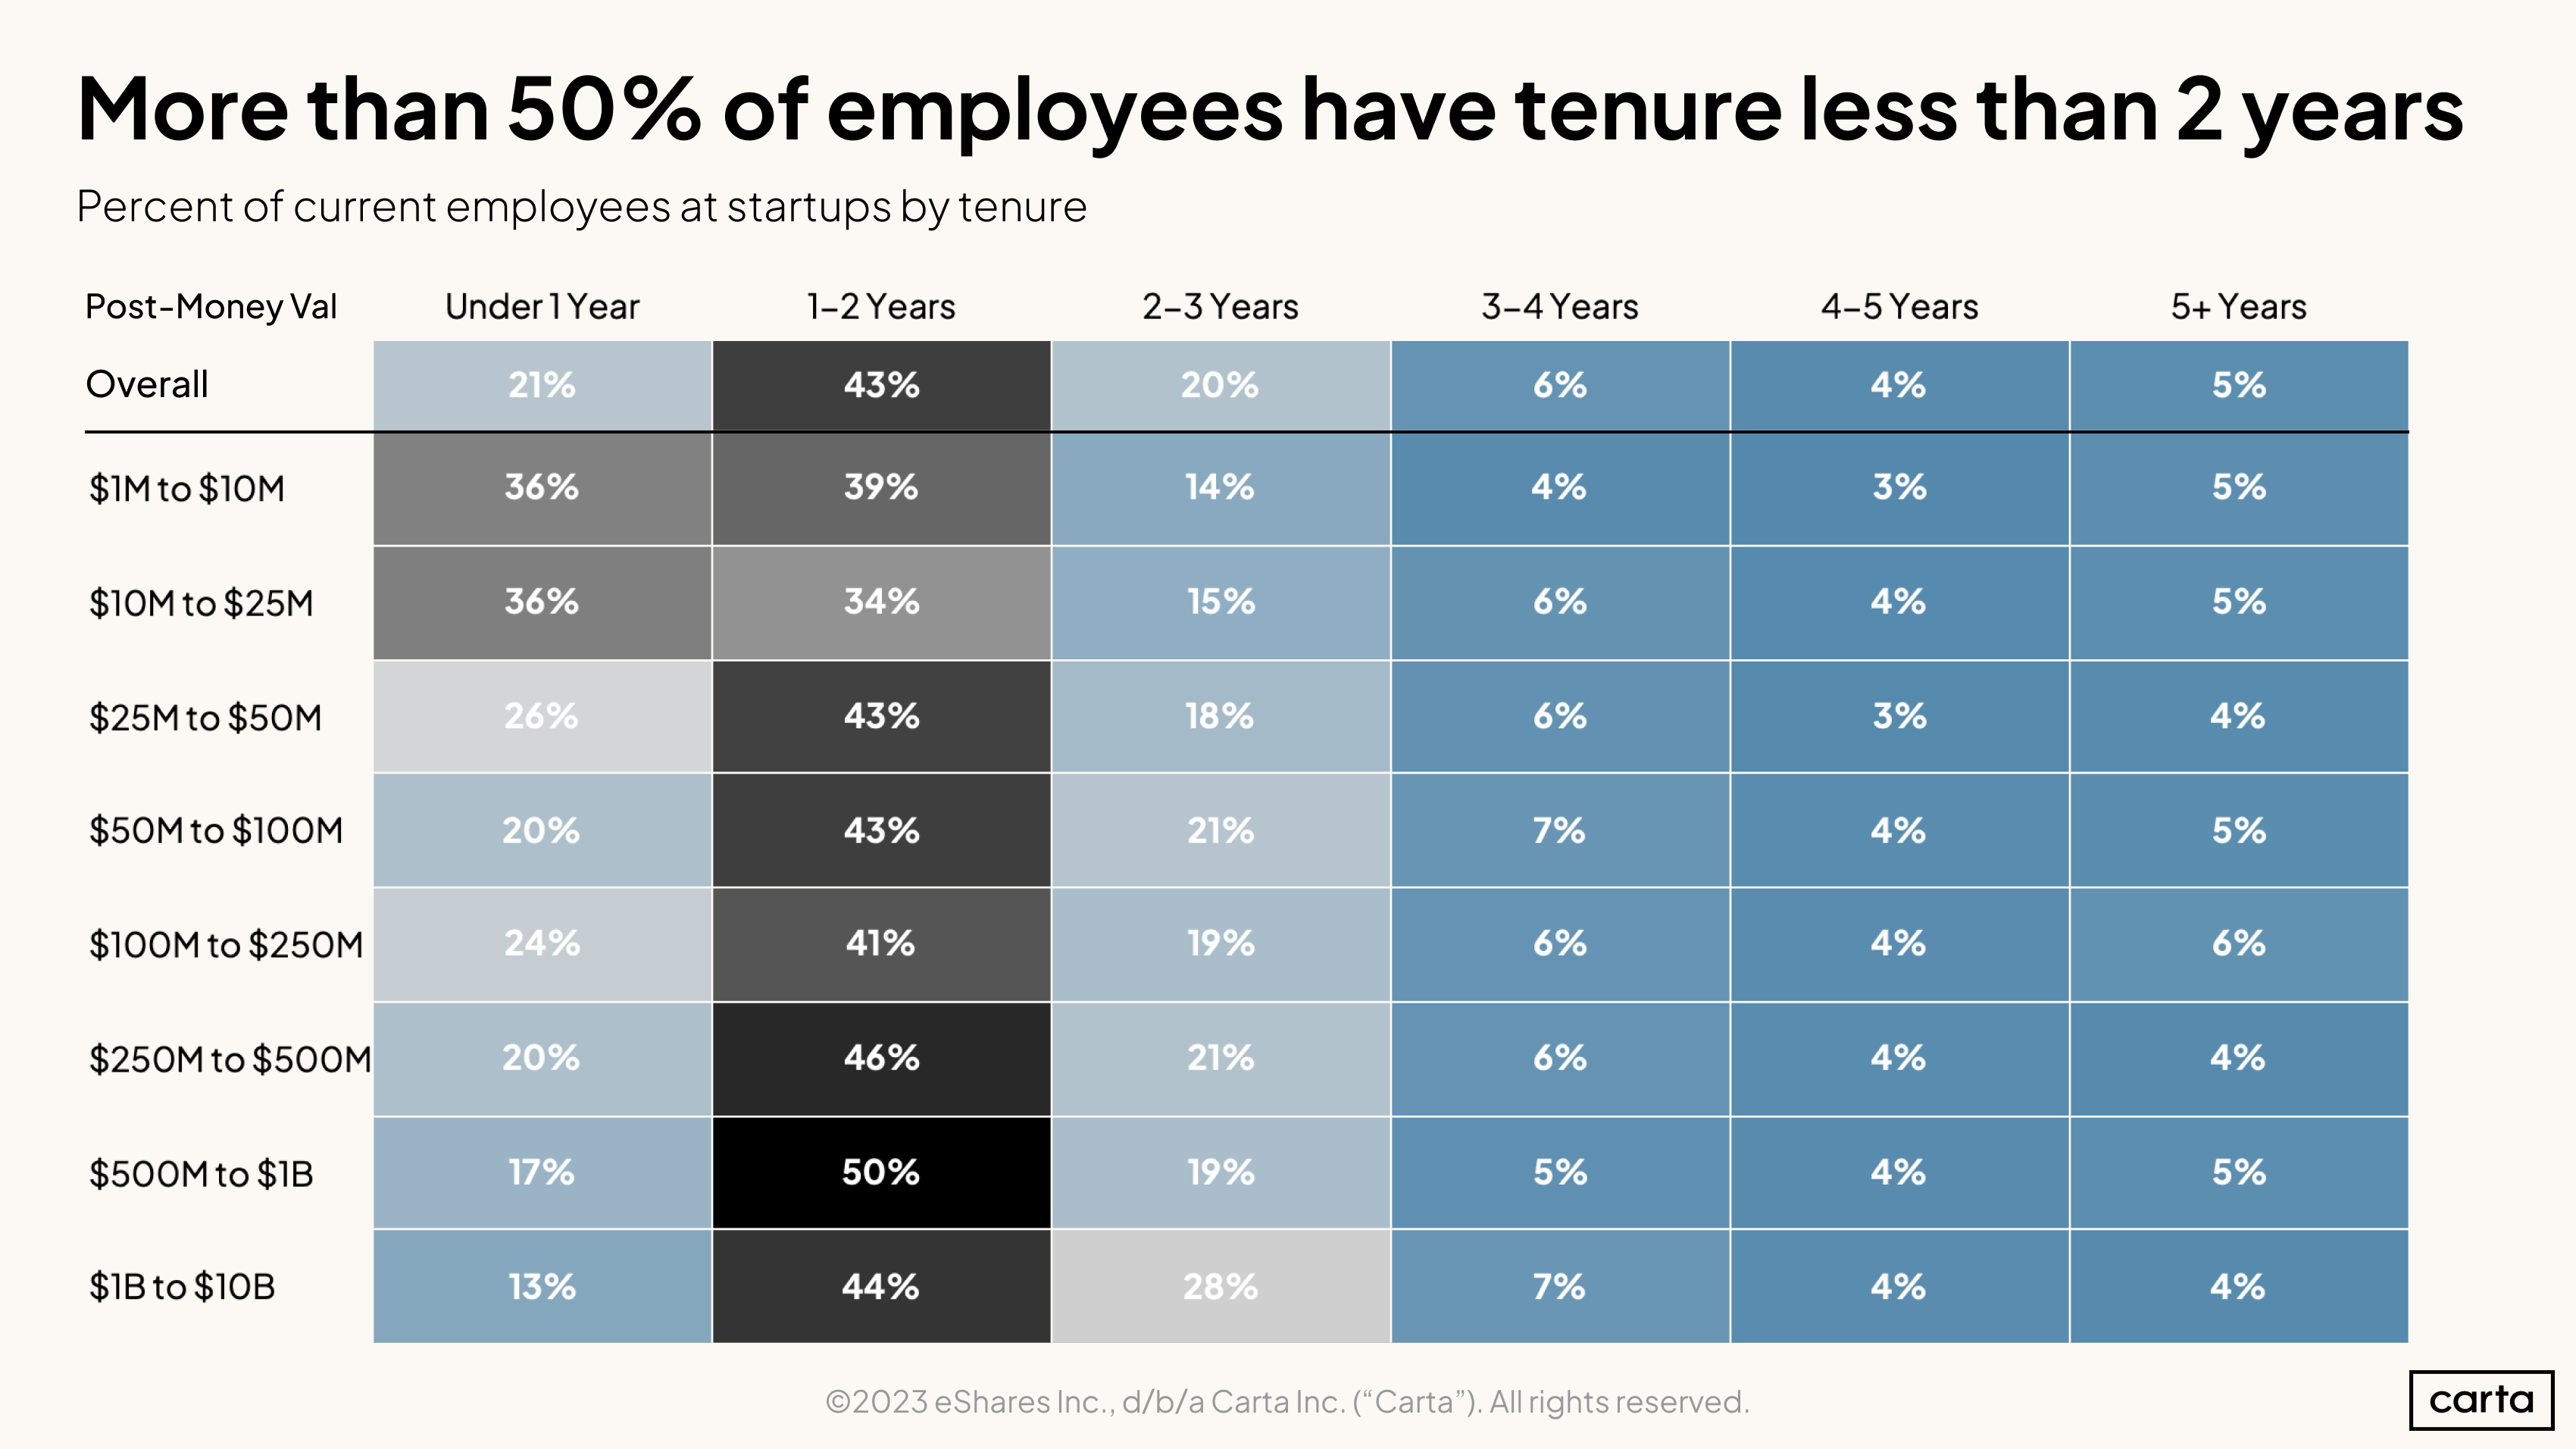
Even in this reduced hiring environment, startups are generally staffed by low-tenure employees. Across startups using Carta Total Compensation, 64% of employees have been at the company for under two years.
The tenure distribution shifts toward slightly longer tenures in high-valuation cohorts, in particular once a startup has achieved a $1 billion unicorn valuation.
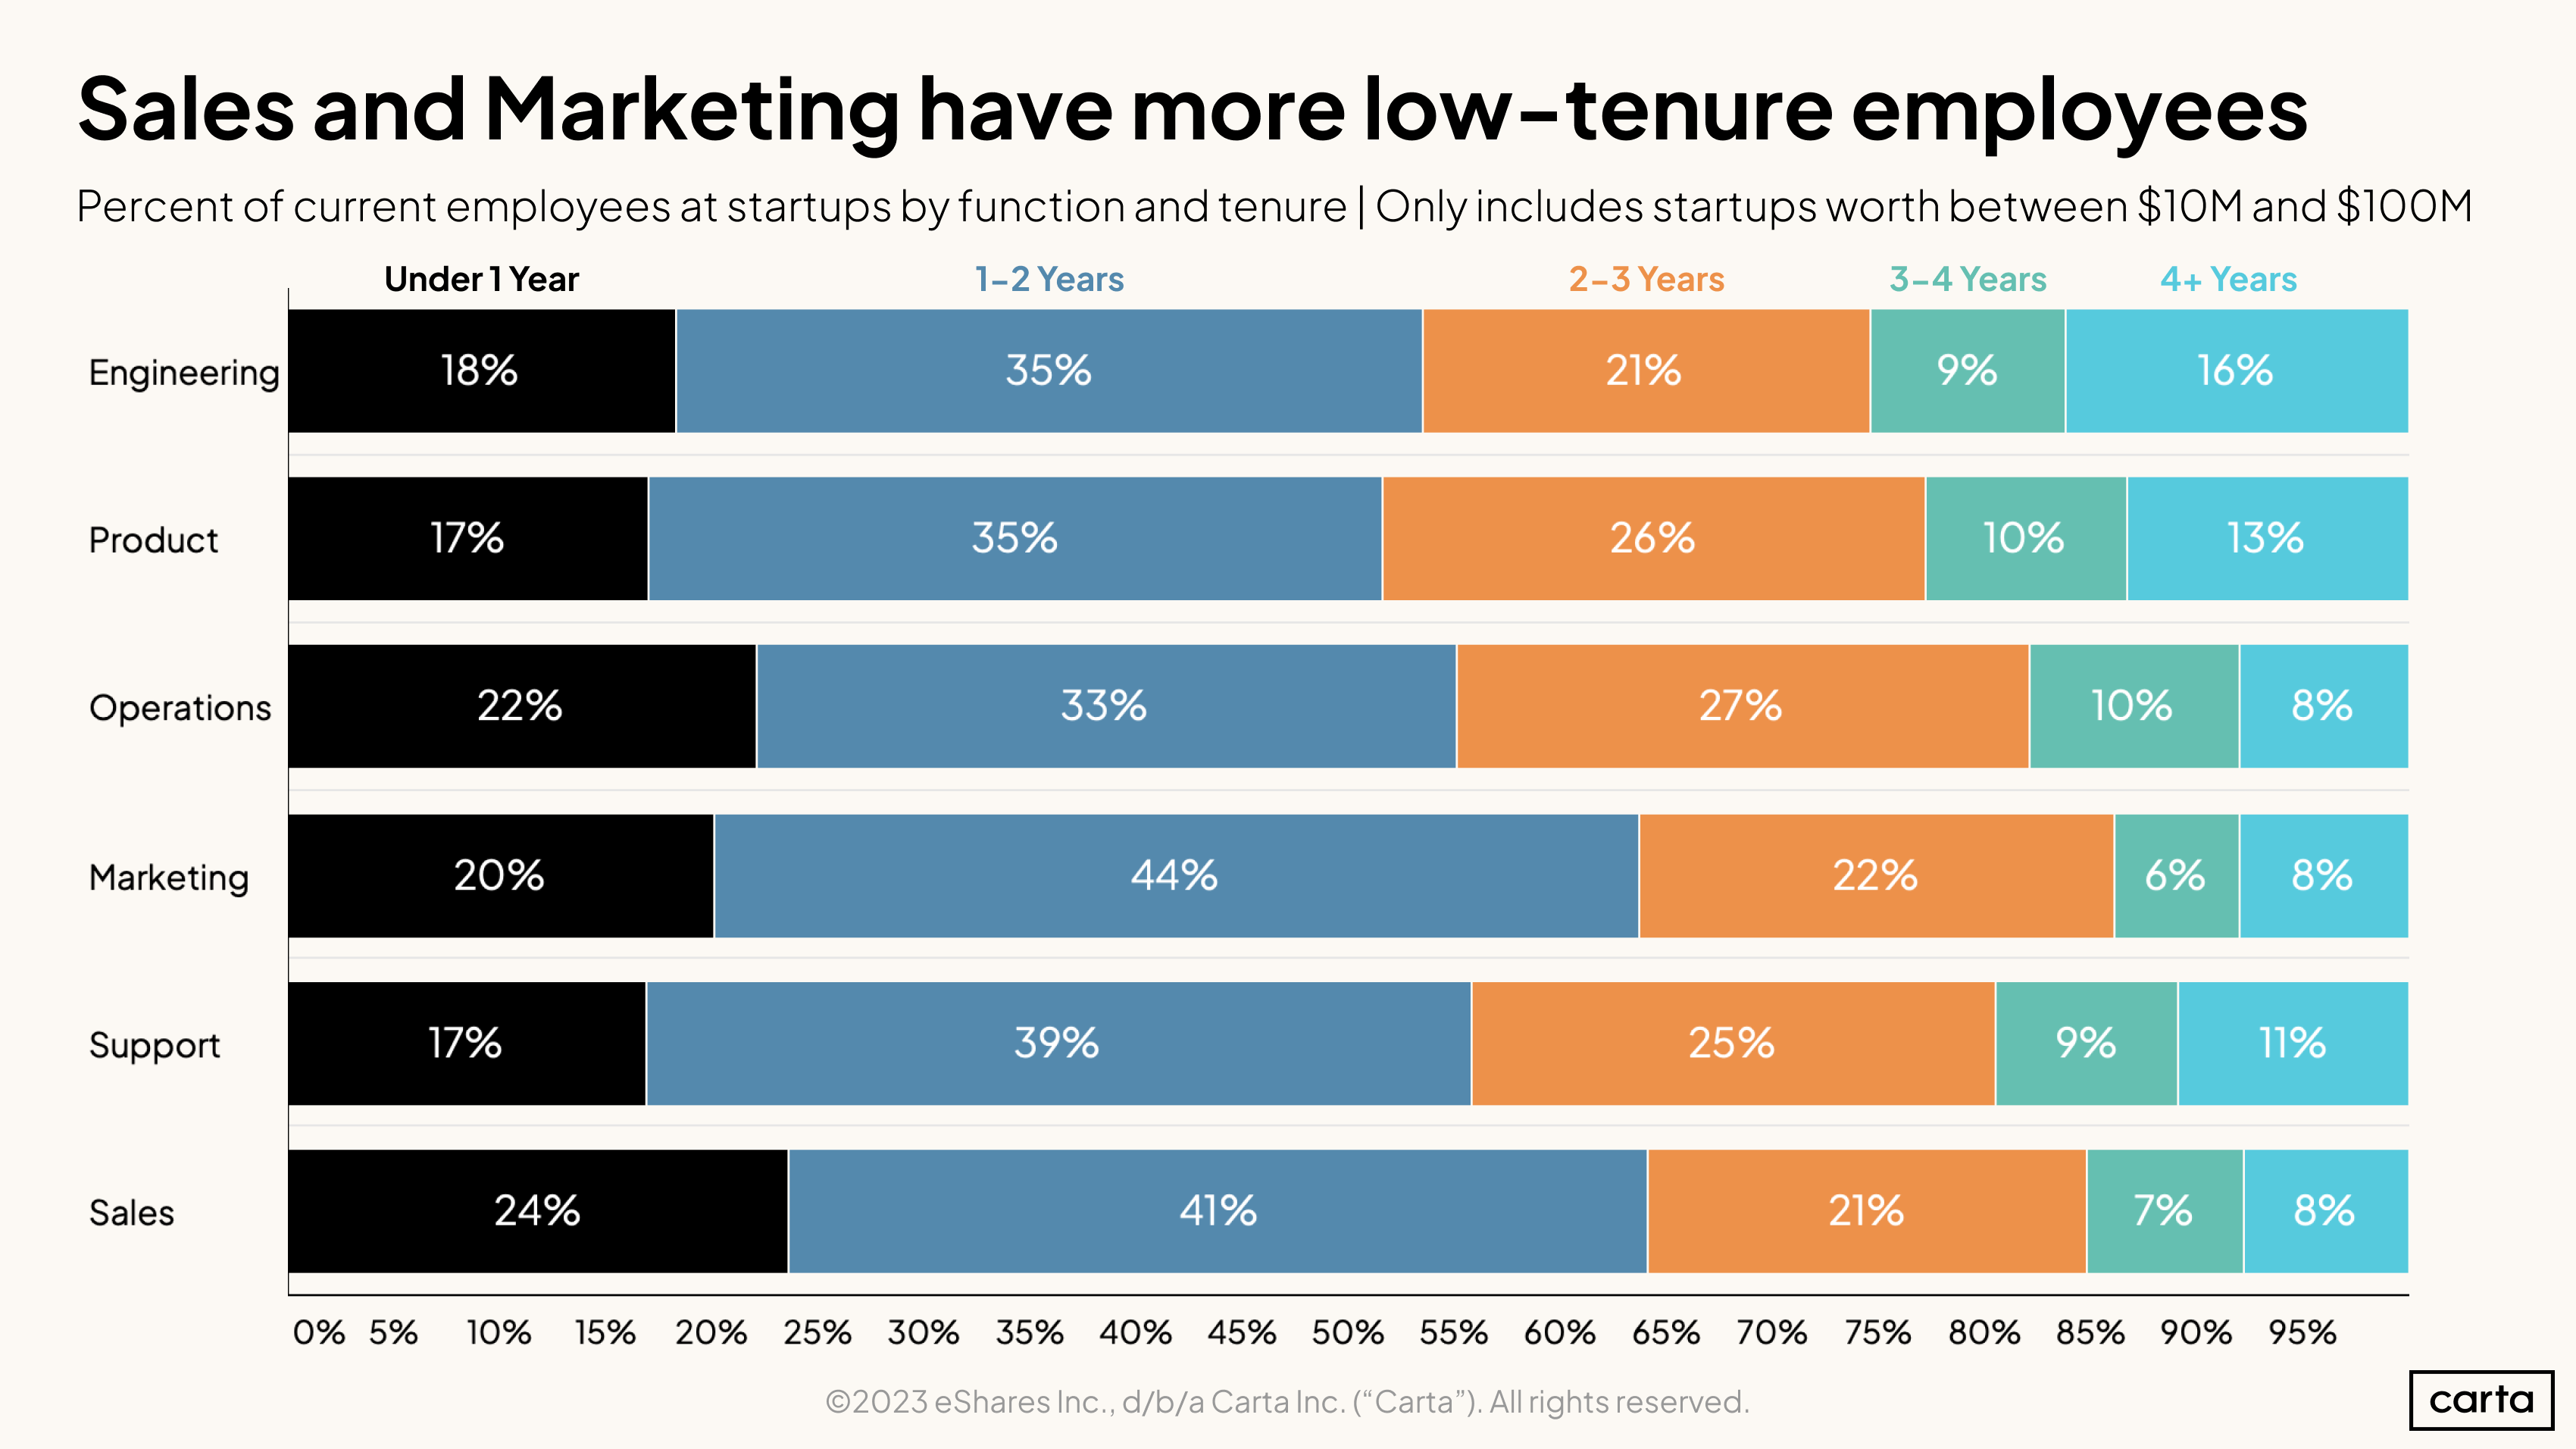
Turnover and tenure vary according to employee job function. Engineering and product teams are more heavily weighted towards long-tenured employees while sales teams have a higher share of recent hires.
Salary trends
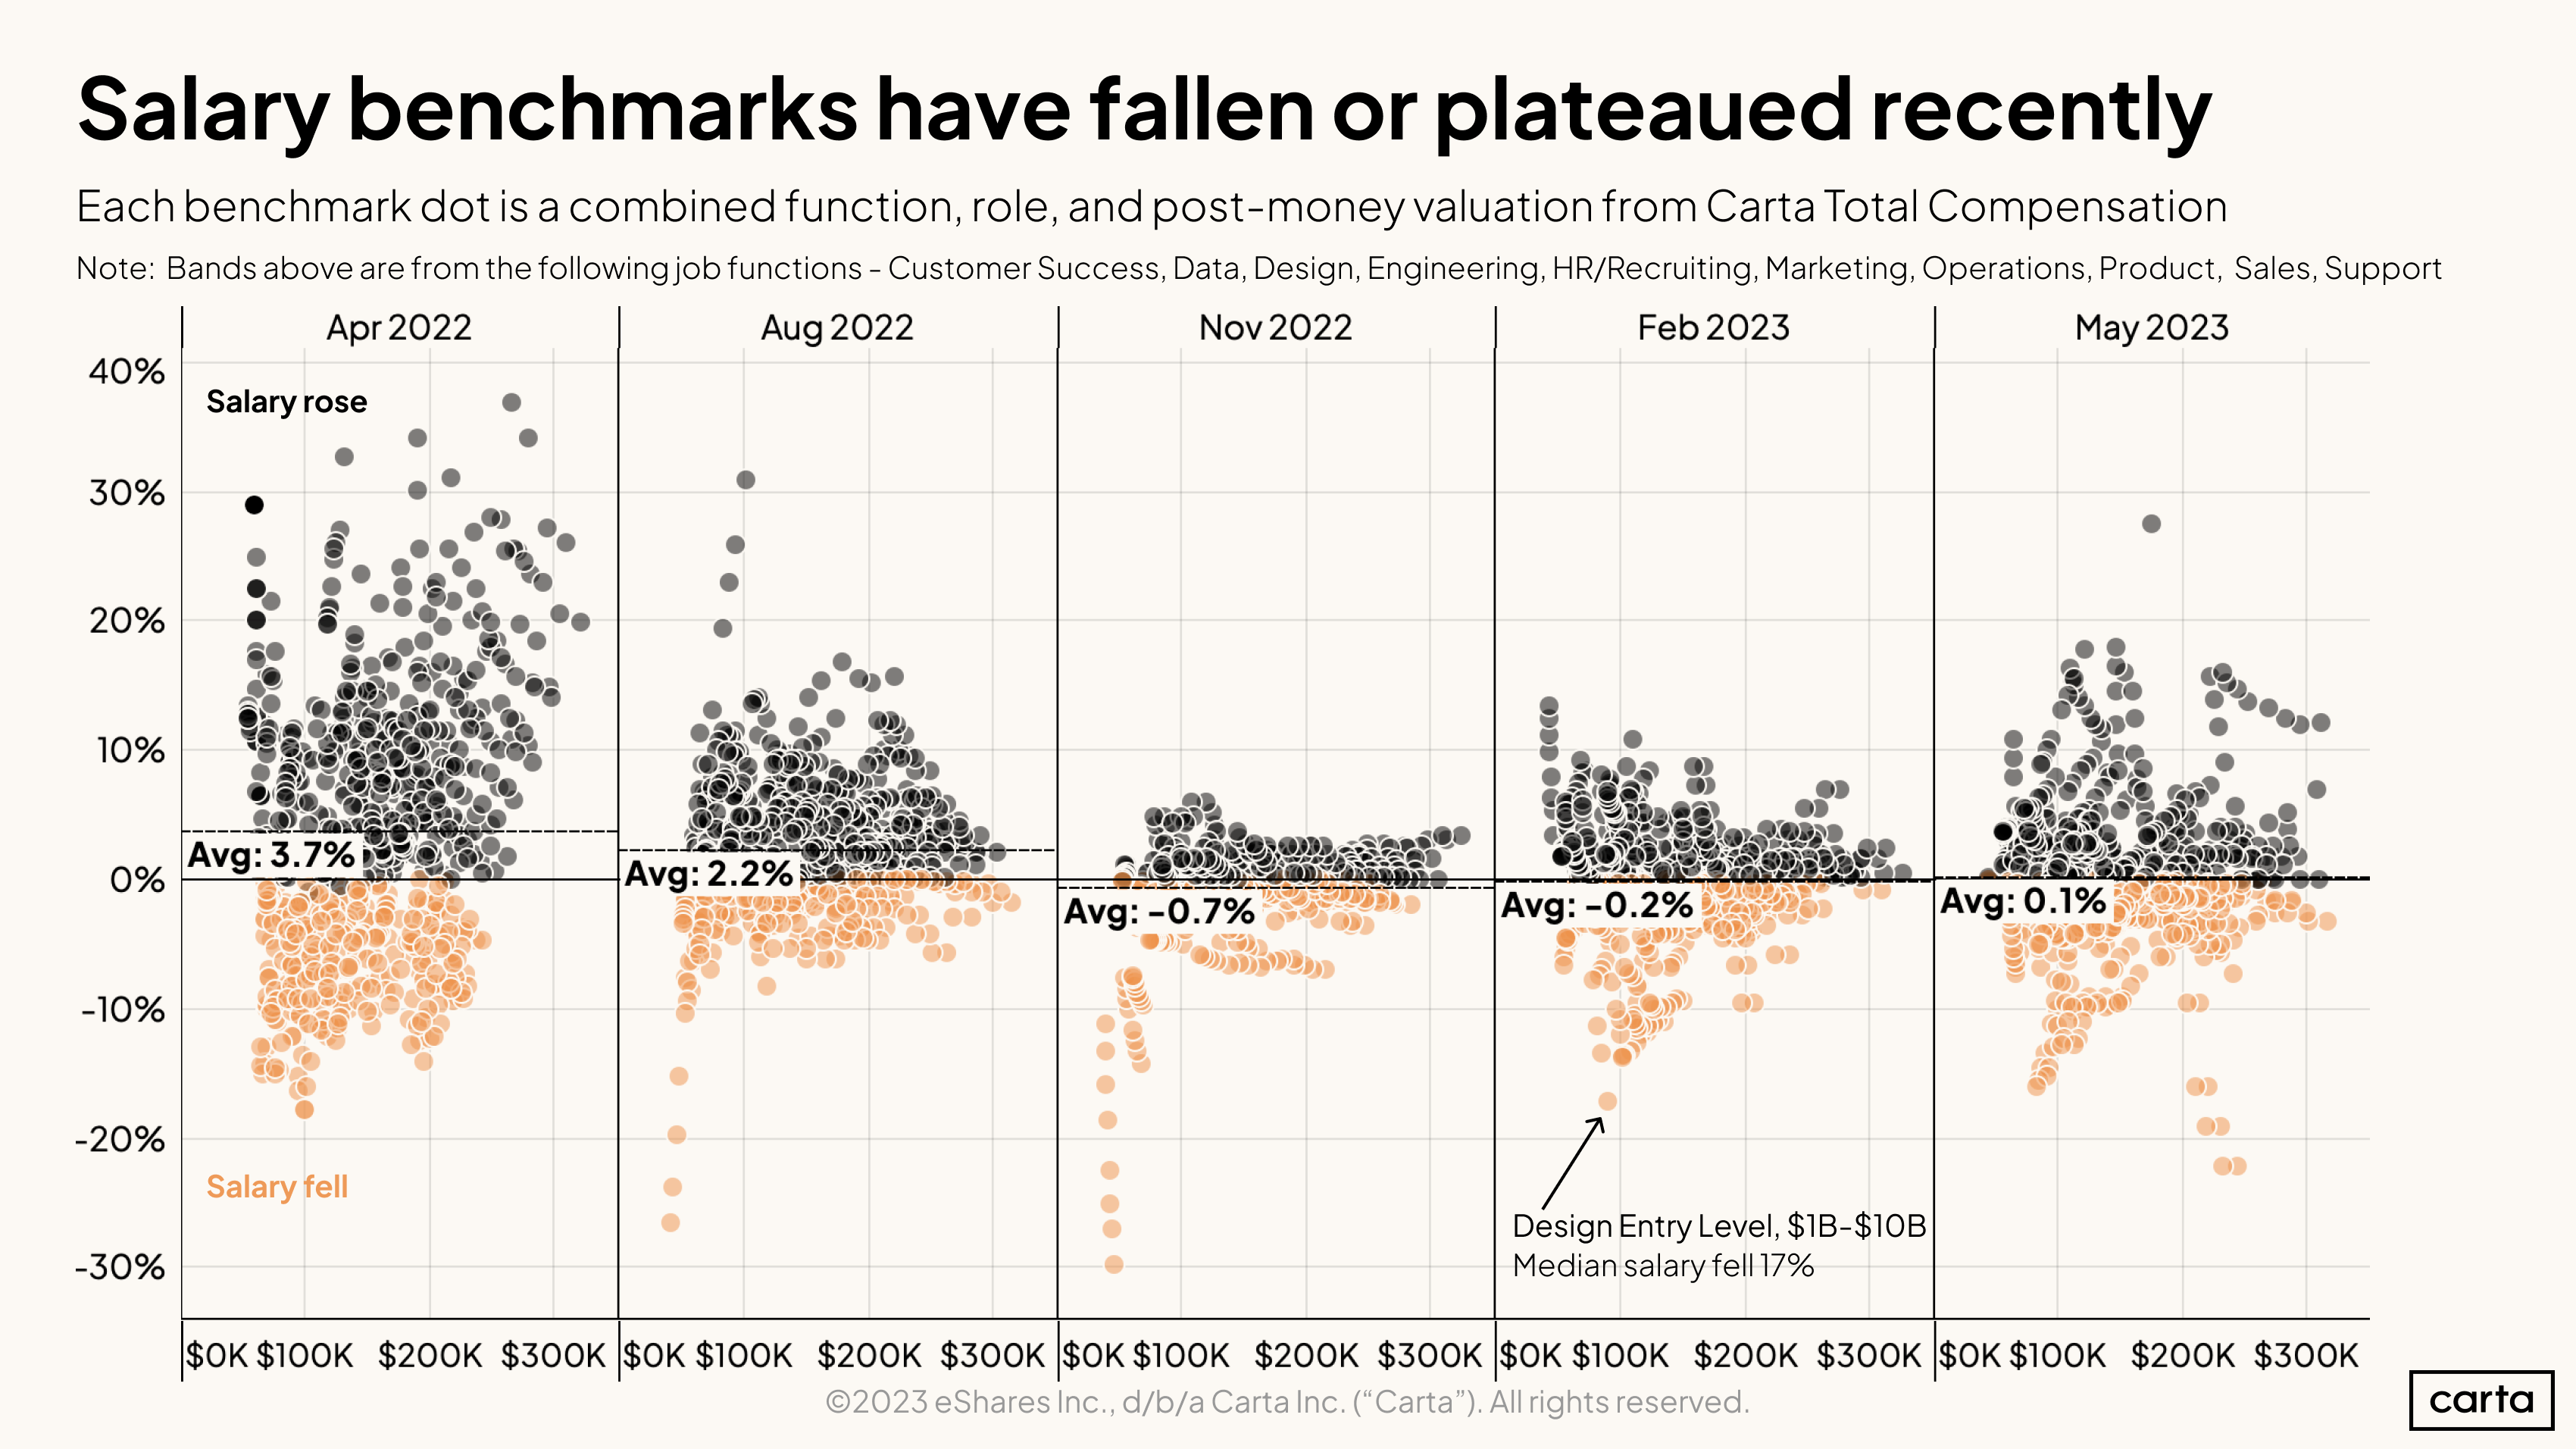
Startup layoffs and hiring reductions have begun affecting salaries. On average, our salary benchmarks rose 2.2% from April to August 2022. Since then, the average has either declined slightly or remained flat.
Each dot in the chart above represents a salary benchmark within Carta Total Comp. These are defined as the combination of a job function, role, and valuation—for example, an engineering manager at a company worth $50M-$100M. The data shows that bands have responded in varied ways to the economic pressures of the past nine months, but the overall trend is towards salary stagnation.
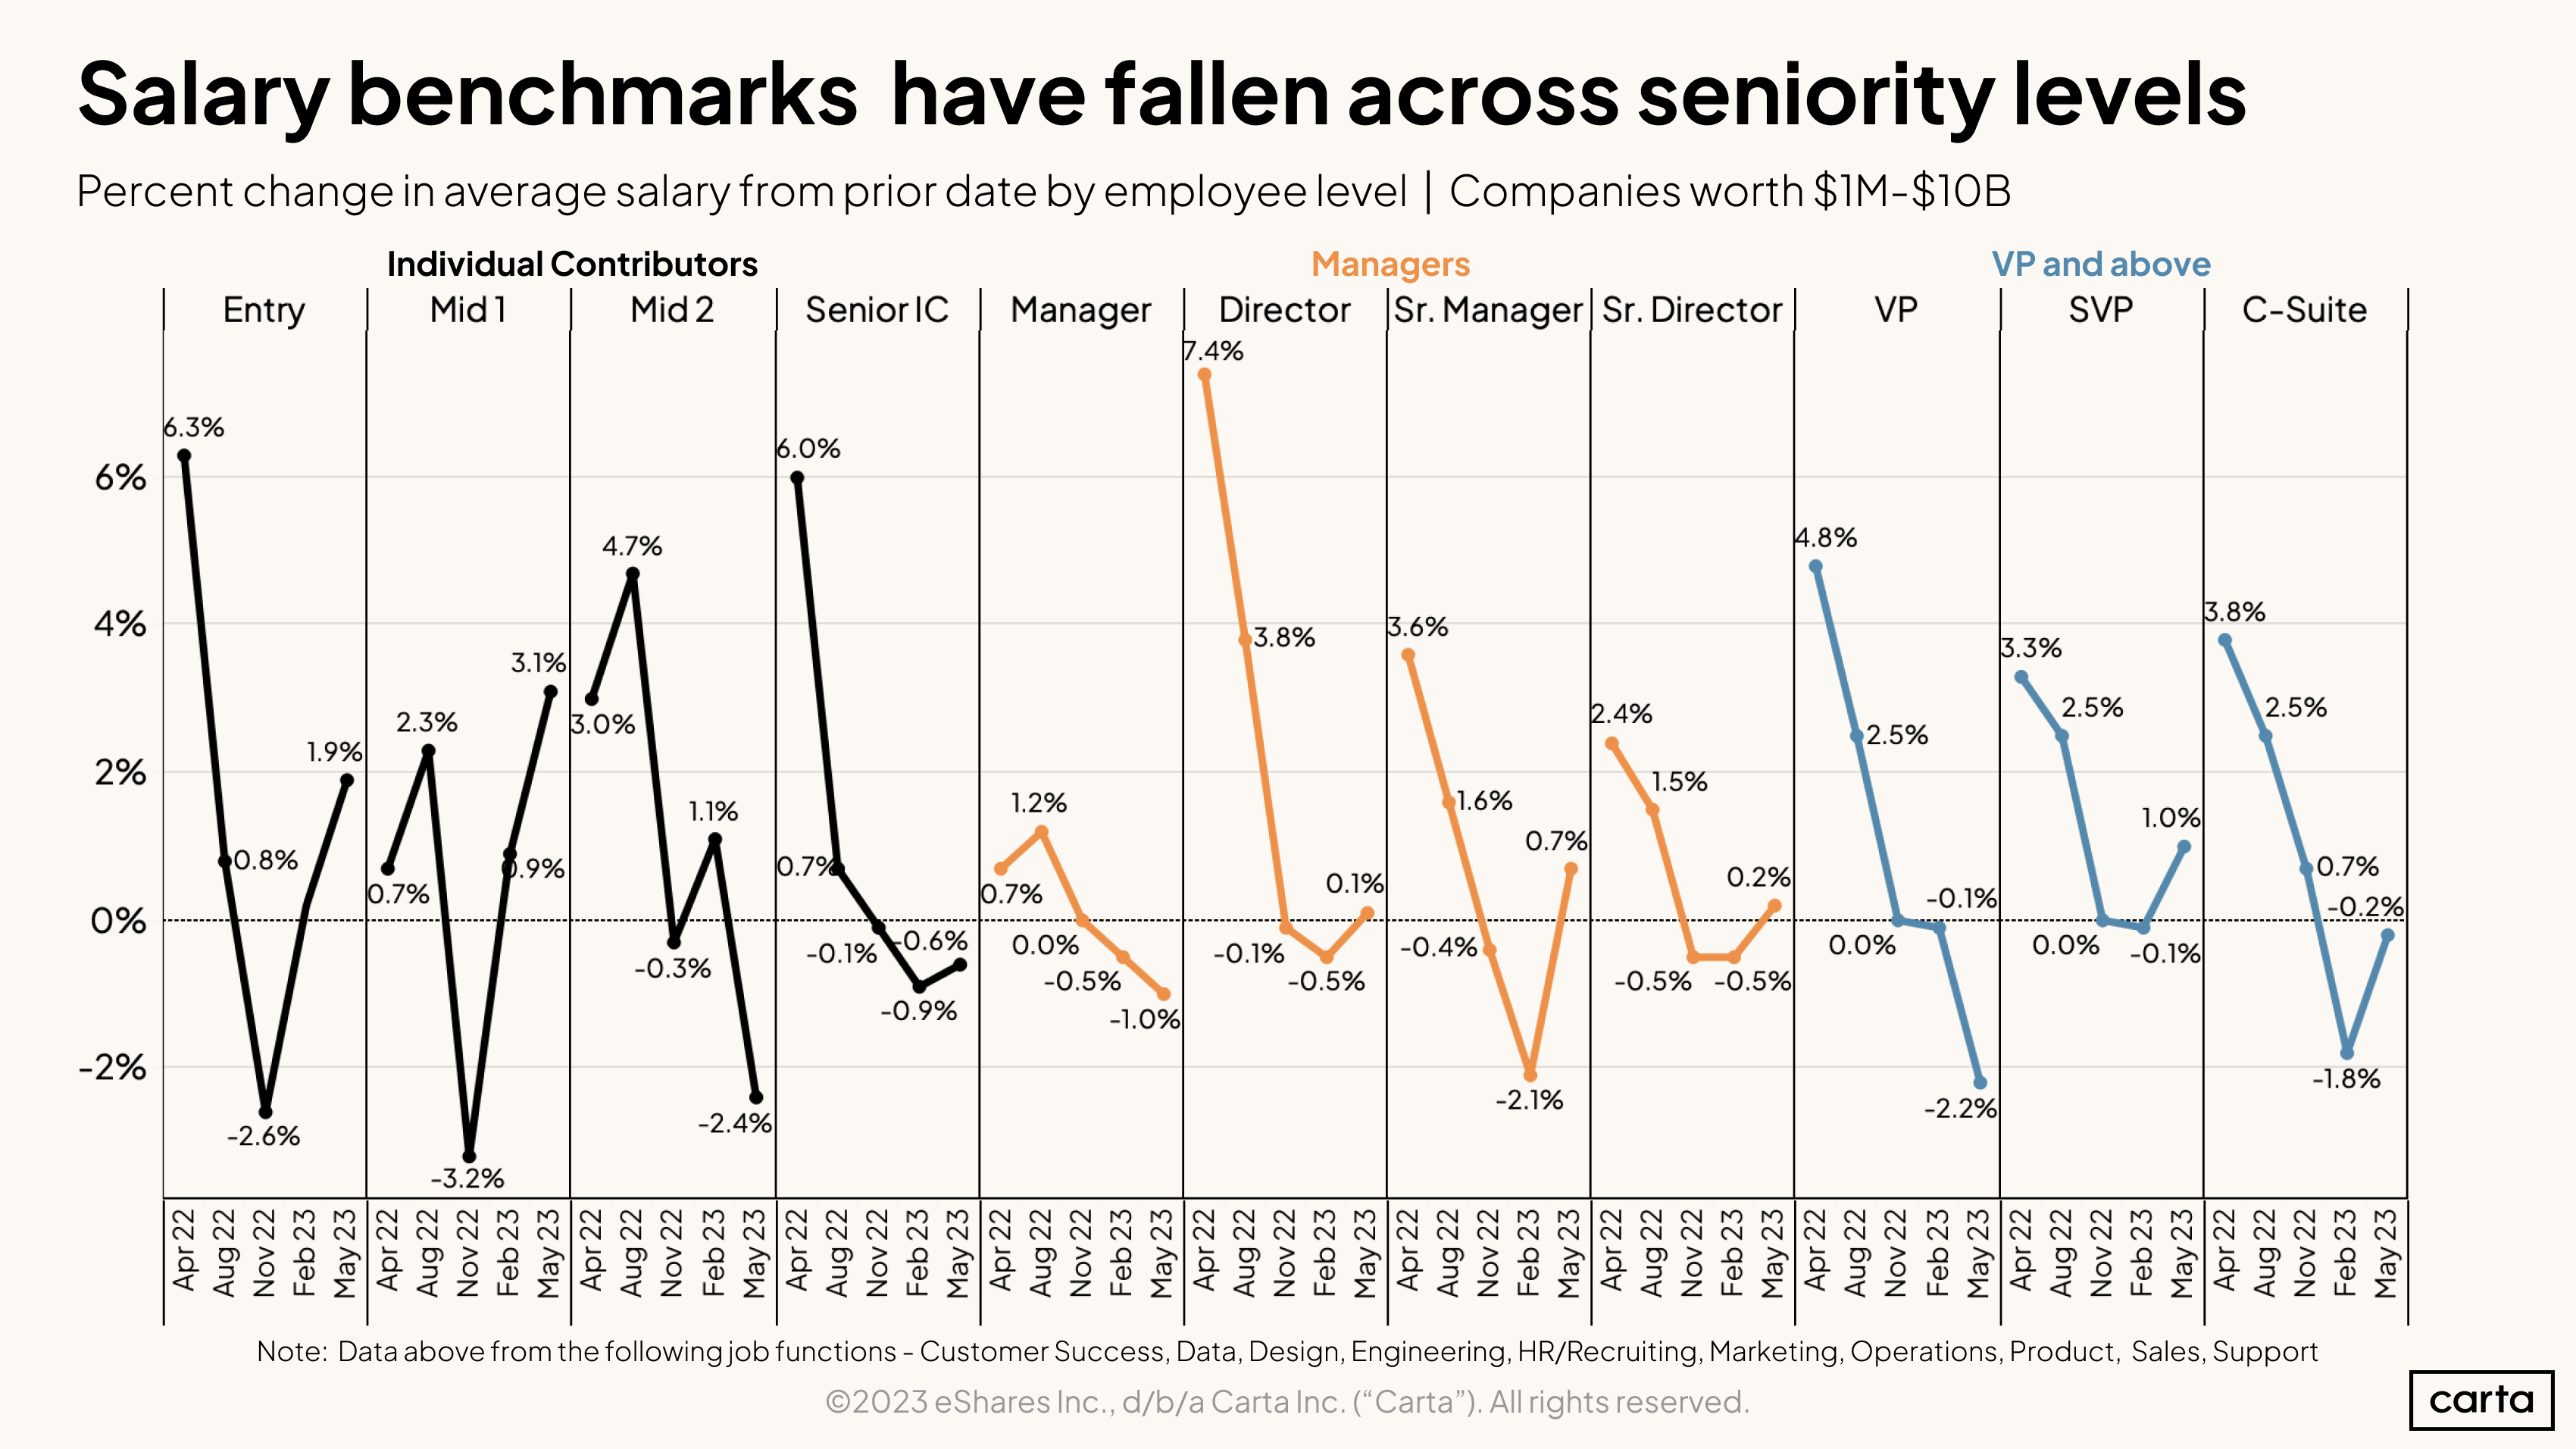
When you split the bands by seniority, the patterns remain much the same. Employees across all levels, from entry workers all the way to the C-suite, saw their average salary benchmarks decline in late 2022 or early 2023.
This pullback is driven in part by fewer new hire offers. This less-competitive talent market means that companies are more reluctant to pay above market rate, which puts downward pressure on the benchmarks overall.
Some roles, like early-career individual contributors, saw salary benchmark increases from February to May of this year. But overall trends are not fundamentally different for senior employees versus junior ones.
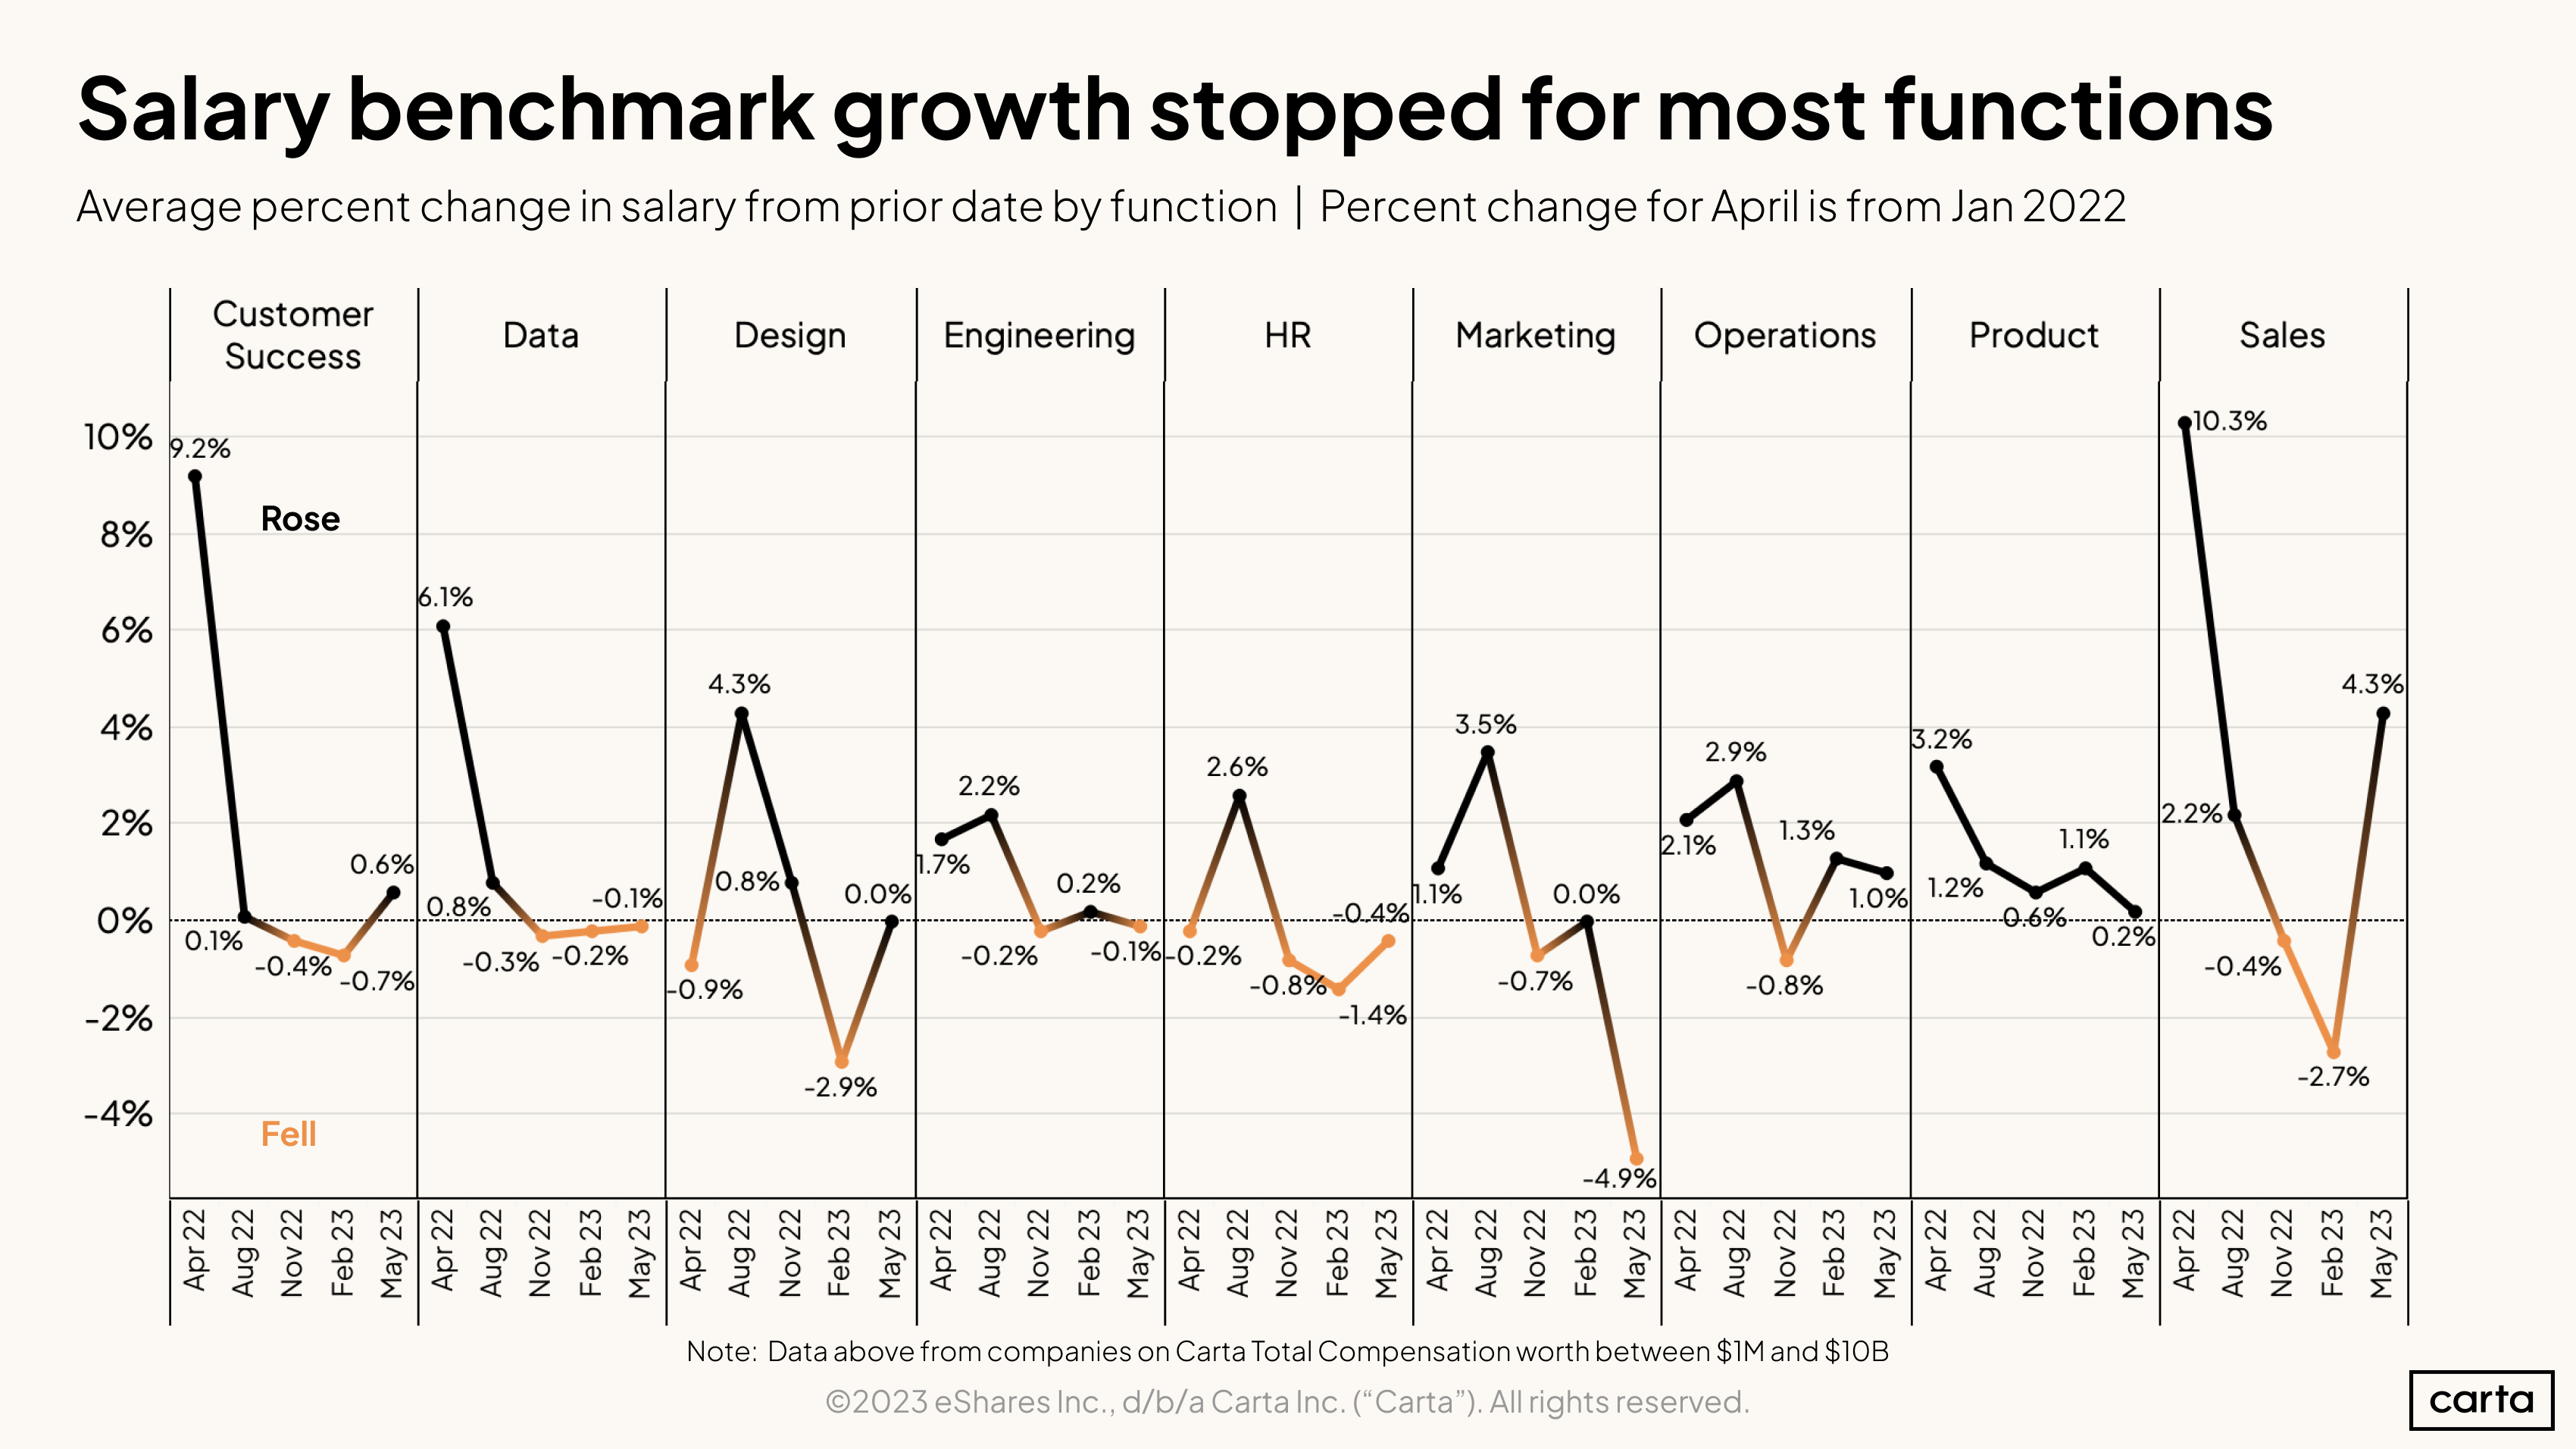
The same data split this time by function shows a little more variation. Salary benchmarks have plateaued across many startup departments (engineering, product, and data most clearly). Marketing benchmarks continue to suffer declines, while sales saw a relatively robust bounce in the most recent quarter or so.
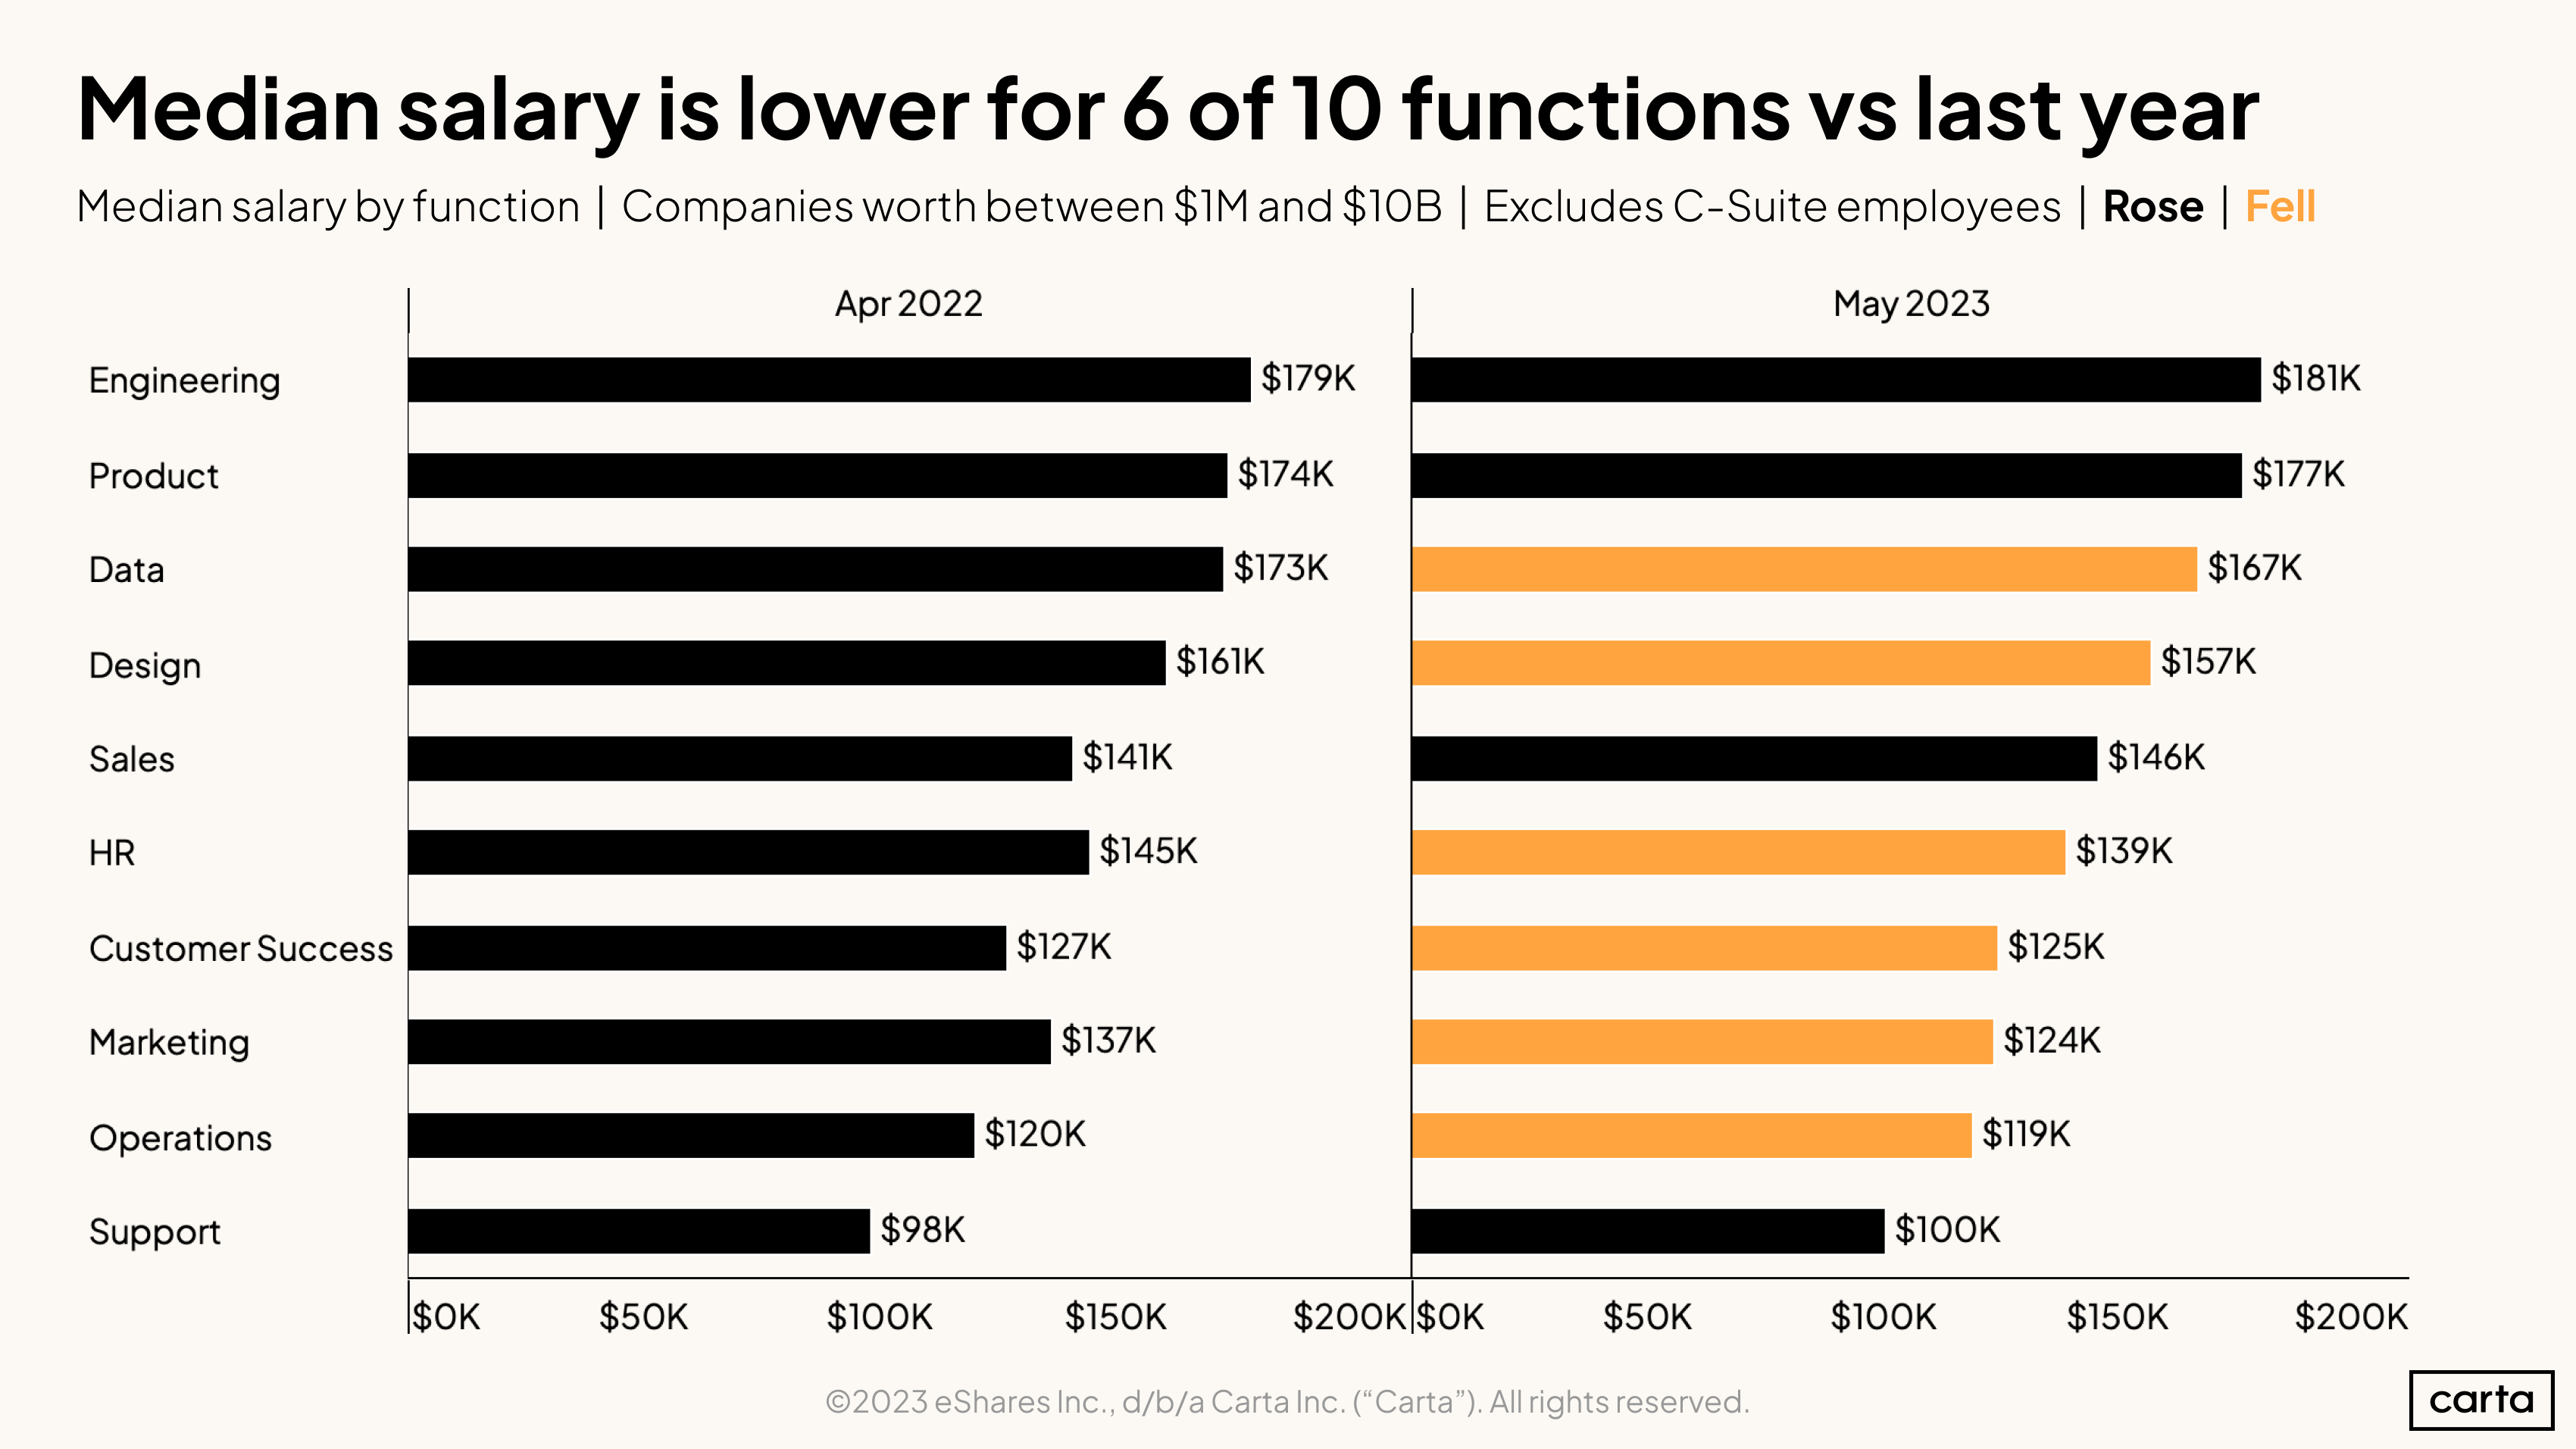
Overall, median salaries are lower in six out of the 10 core startup functions. Engineering is still the most highly compensated function, followed by product, data, and design roles. Even business areas that saw median salaries rise over the past year only eked out small percentage gains.
Equity trends

The real drama in startup compensation over the prior half year has taken place in equity packages. While salary benchmarks have remained essentially unchanged over this timeframe, the average equity benchmark has declined 26%.
This analysis doesn’t refer to the nominal dollar value of the equity in question—that would be highly sensitive to the decline in startup valuations (and approximating early-stage startup equity value in dollars is a real challenge).
The 26% decline refers instead to the fully diluted percentage of total company equity a given employee receives. New hires today aren’t just receiving the same size slice of a less valuable pie—they are having to make do with a smaller slice altogether.
Why have startups suddenly become much less generous in their equity offers? There are a few possible reasons.
First and foremost: With the sudden influx of talented candidates on the market, negotiating power has shifted back to startups. There are now fewer offers at the upper end of the equity range.
Second, companies will typically replenish their option pools when they raise a new round of financing. Funding rounds have grown scarcer, so companies have become more conservative with the remaining available option pool.
Lastly, later-stage companies granting RSUs may have reduced the size of employee grants because using prior equity benchmarks would result in too much dilution if the company has reduced the price-per-share used to determine grants. Many late-stage firms have seen the price per share of their equity fall considerably.
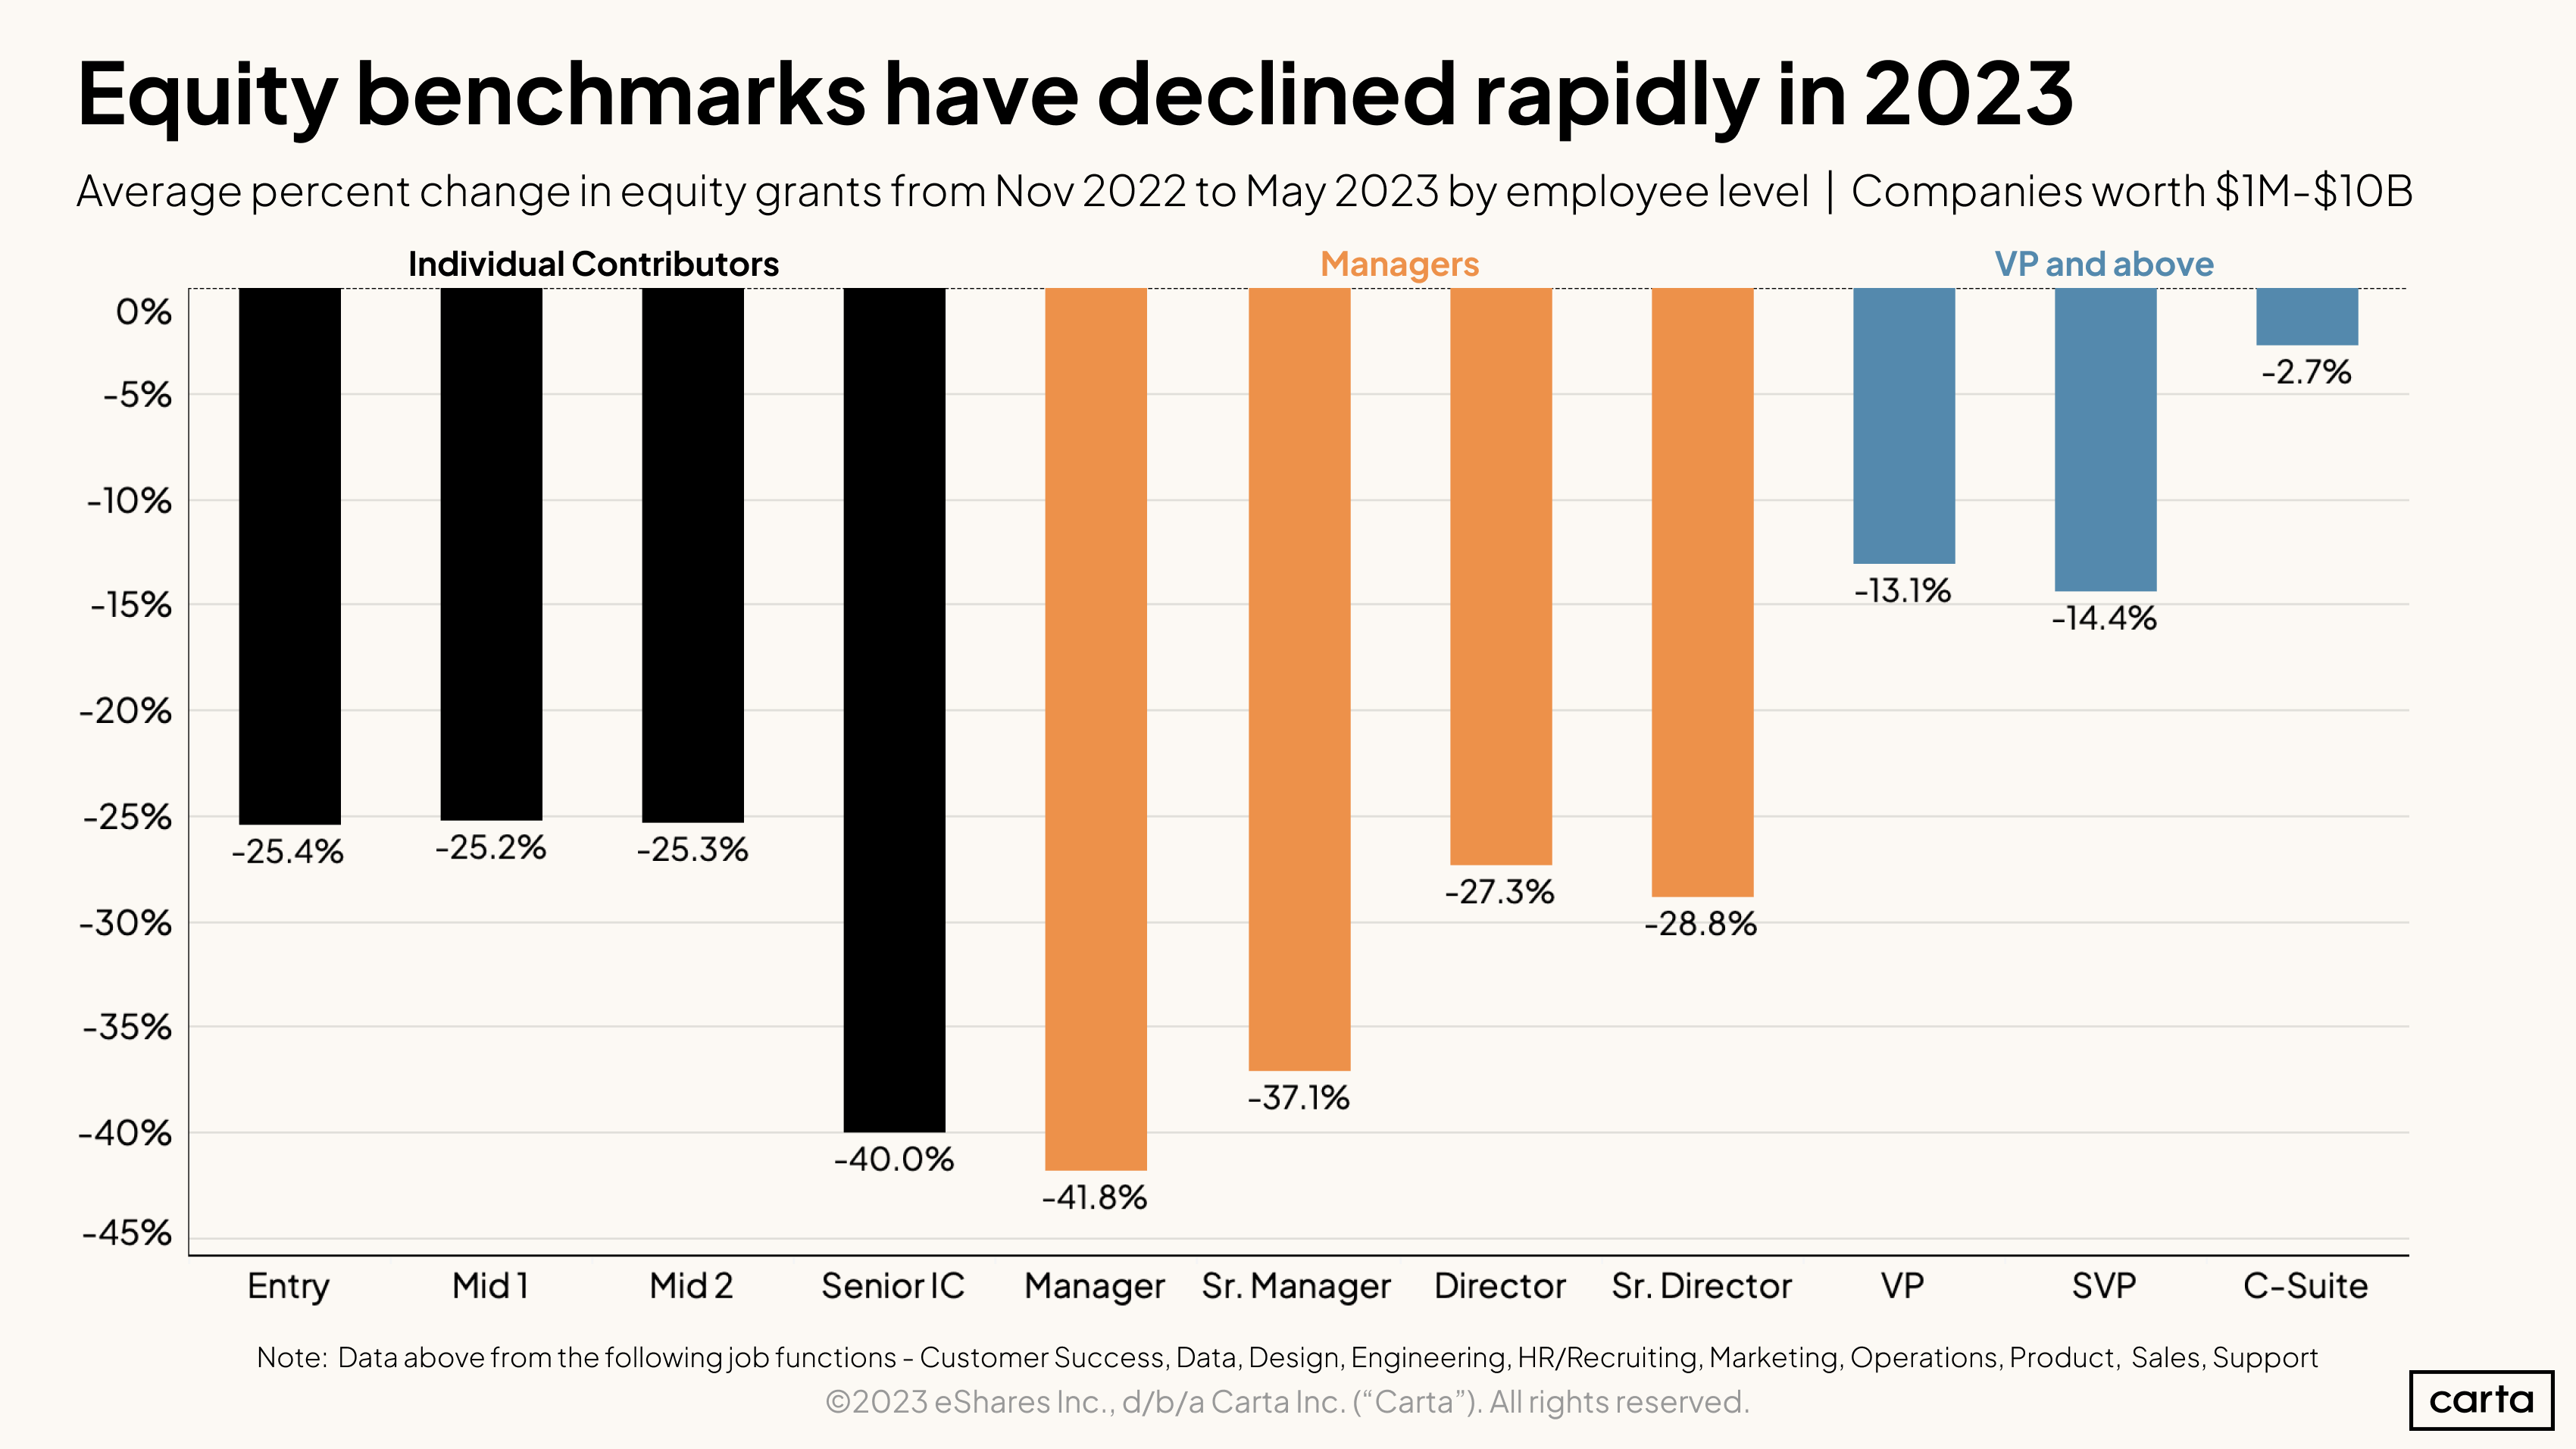
This equity reckoning has not been reserved for junior hires. Benchmarks across seniority levels have fallen, with junior managers seeing the largest reduction.
VPs and above have also seen equity packages decline, though the decline for C-suite candidates has been negligible.
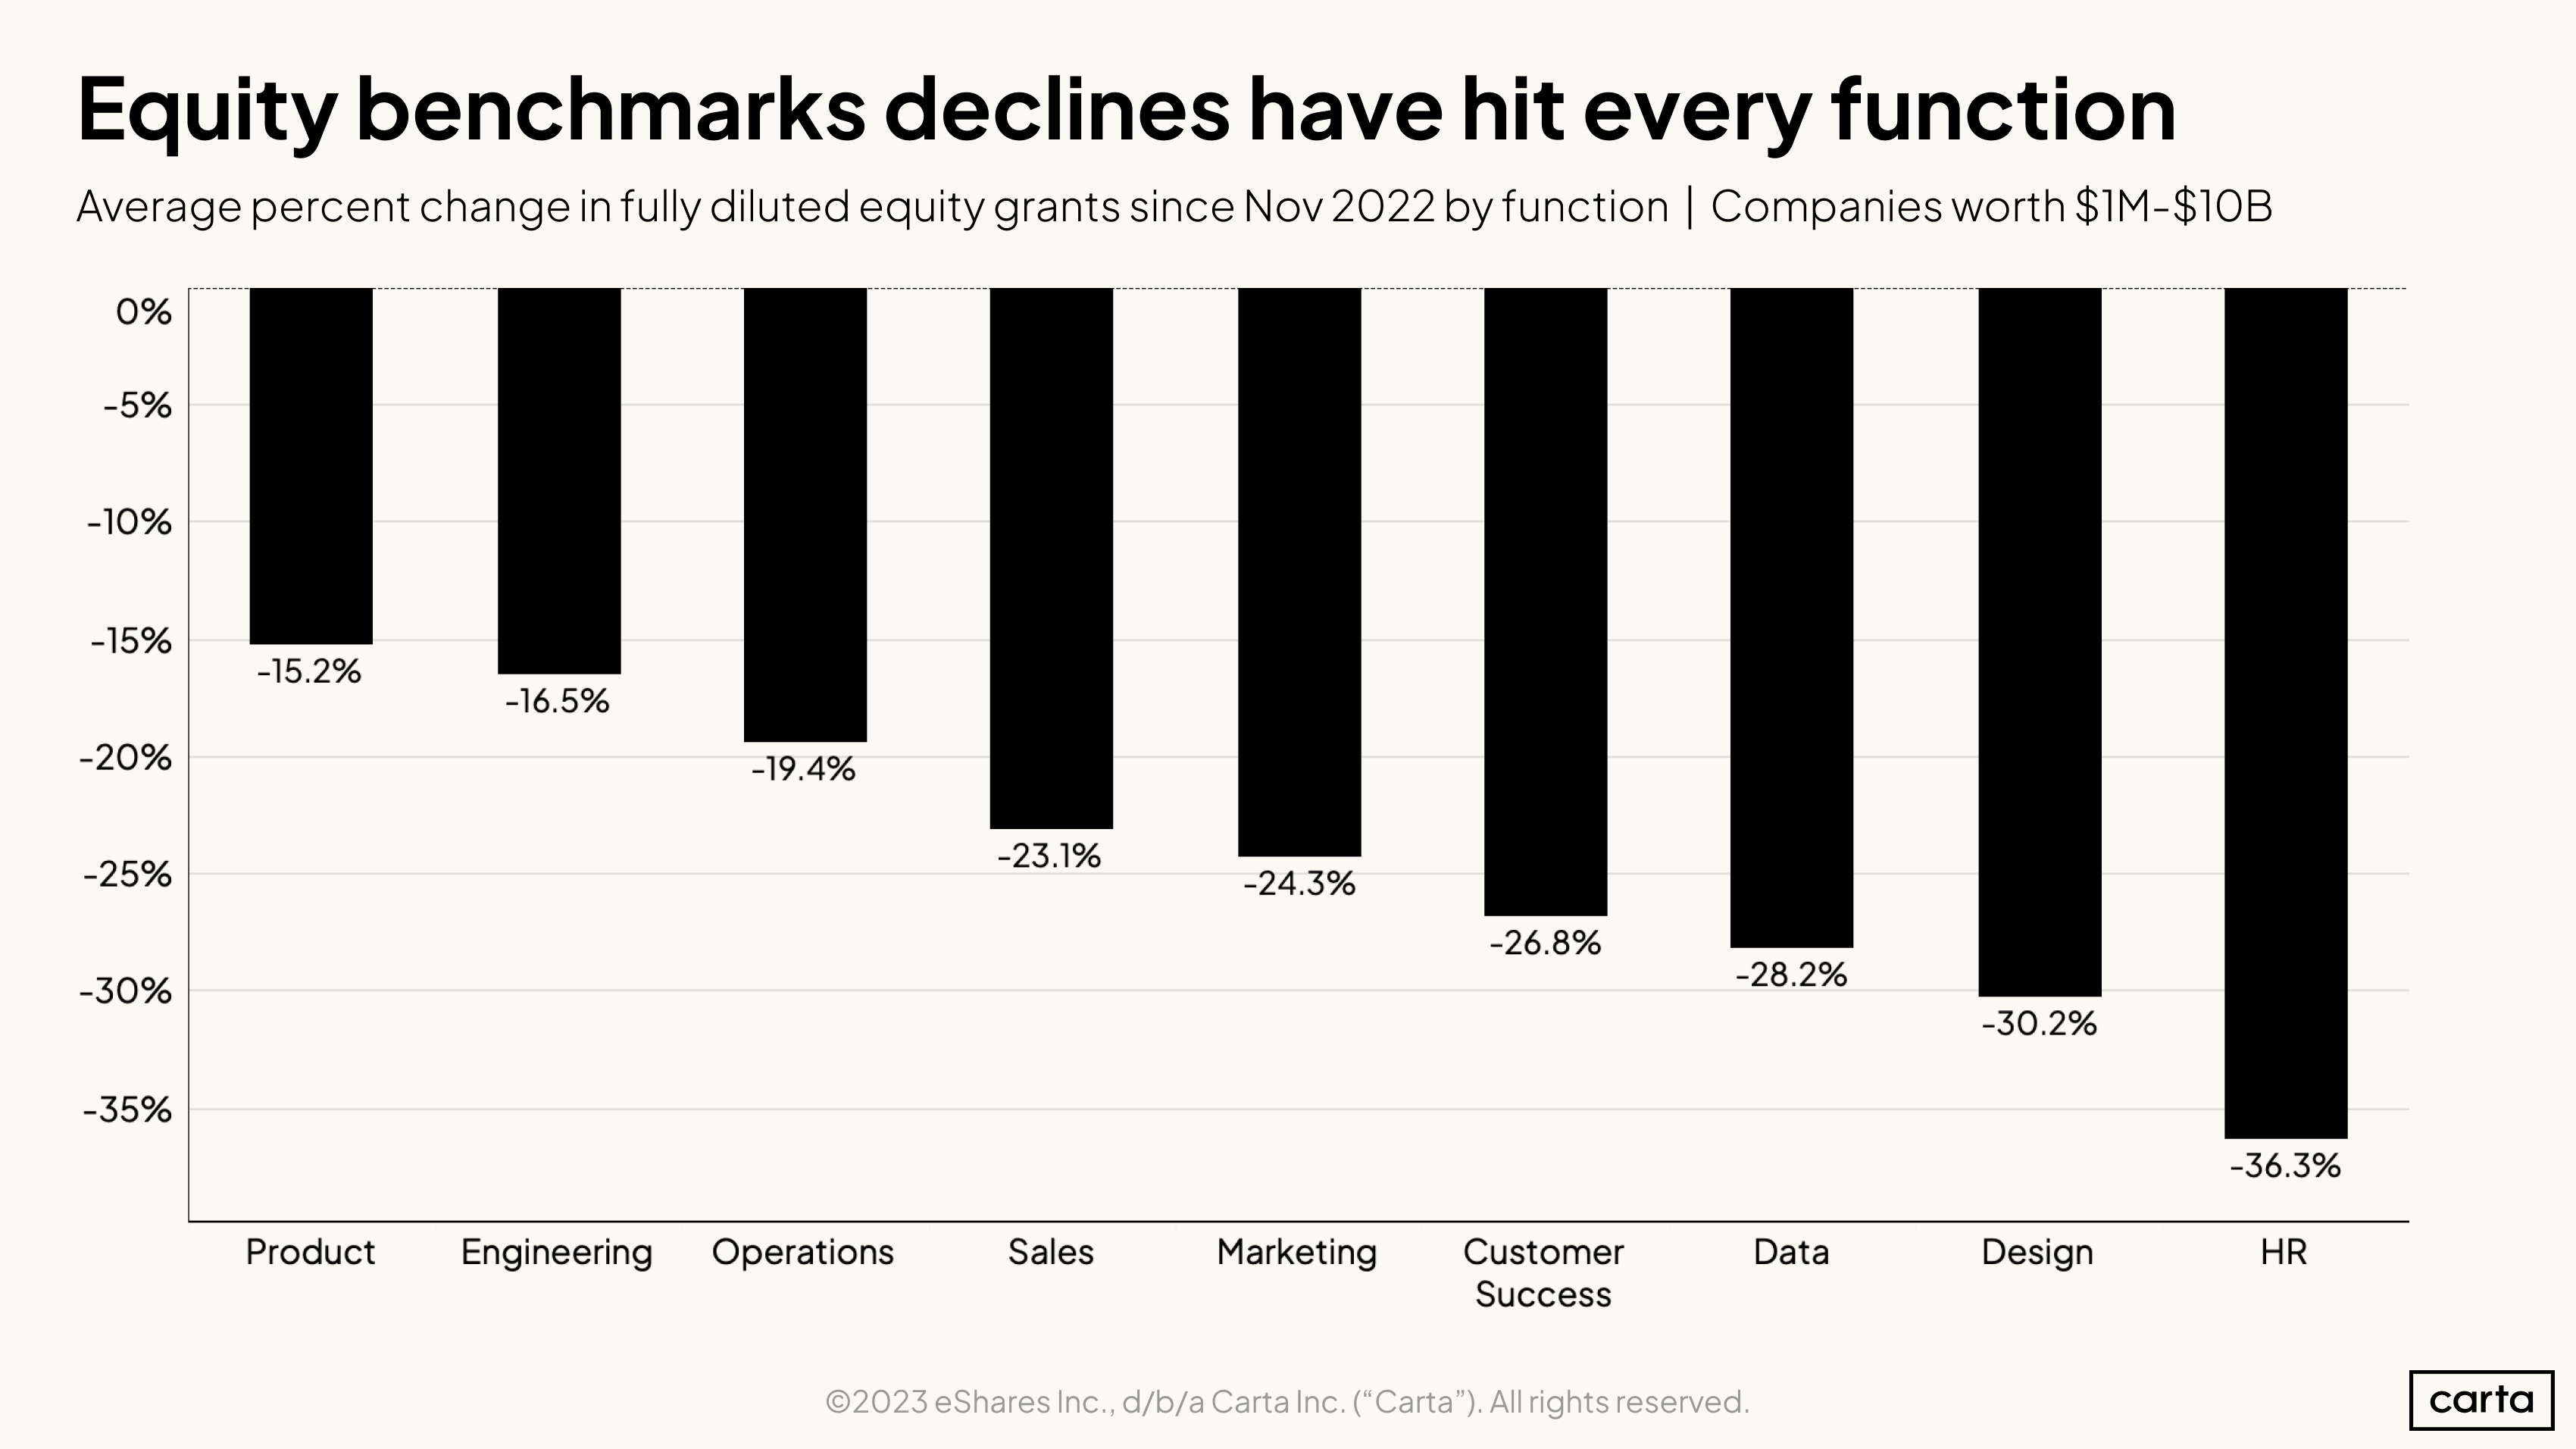
While no function has escaped the shrinking of equity packages, some have fared much better than others. The average equity grant for product and engineering roles fell about 15% from Nov 2022 to May 2023. HR employees, in contrast, saw their equity benchmark decline more than 36% over the same period.
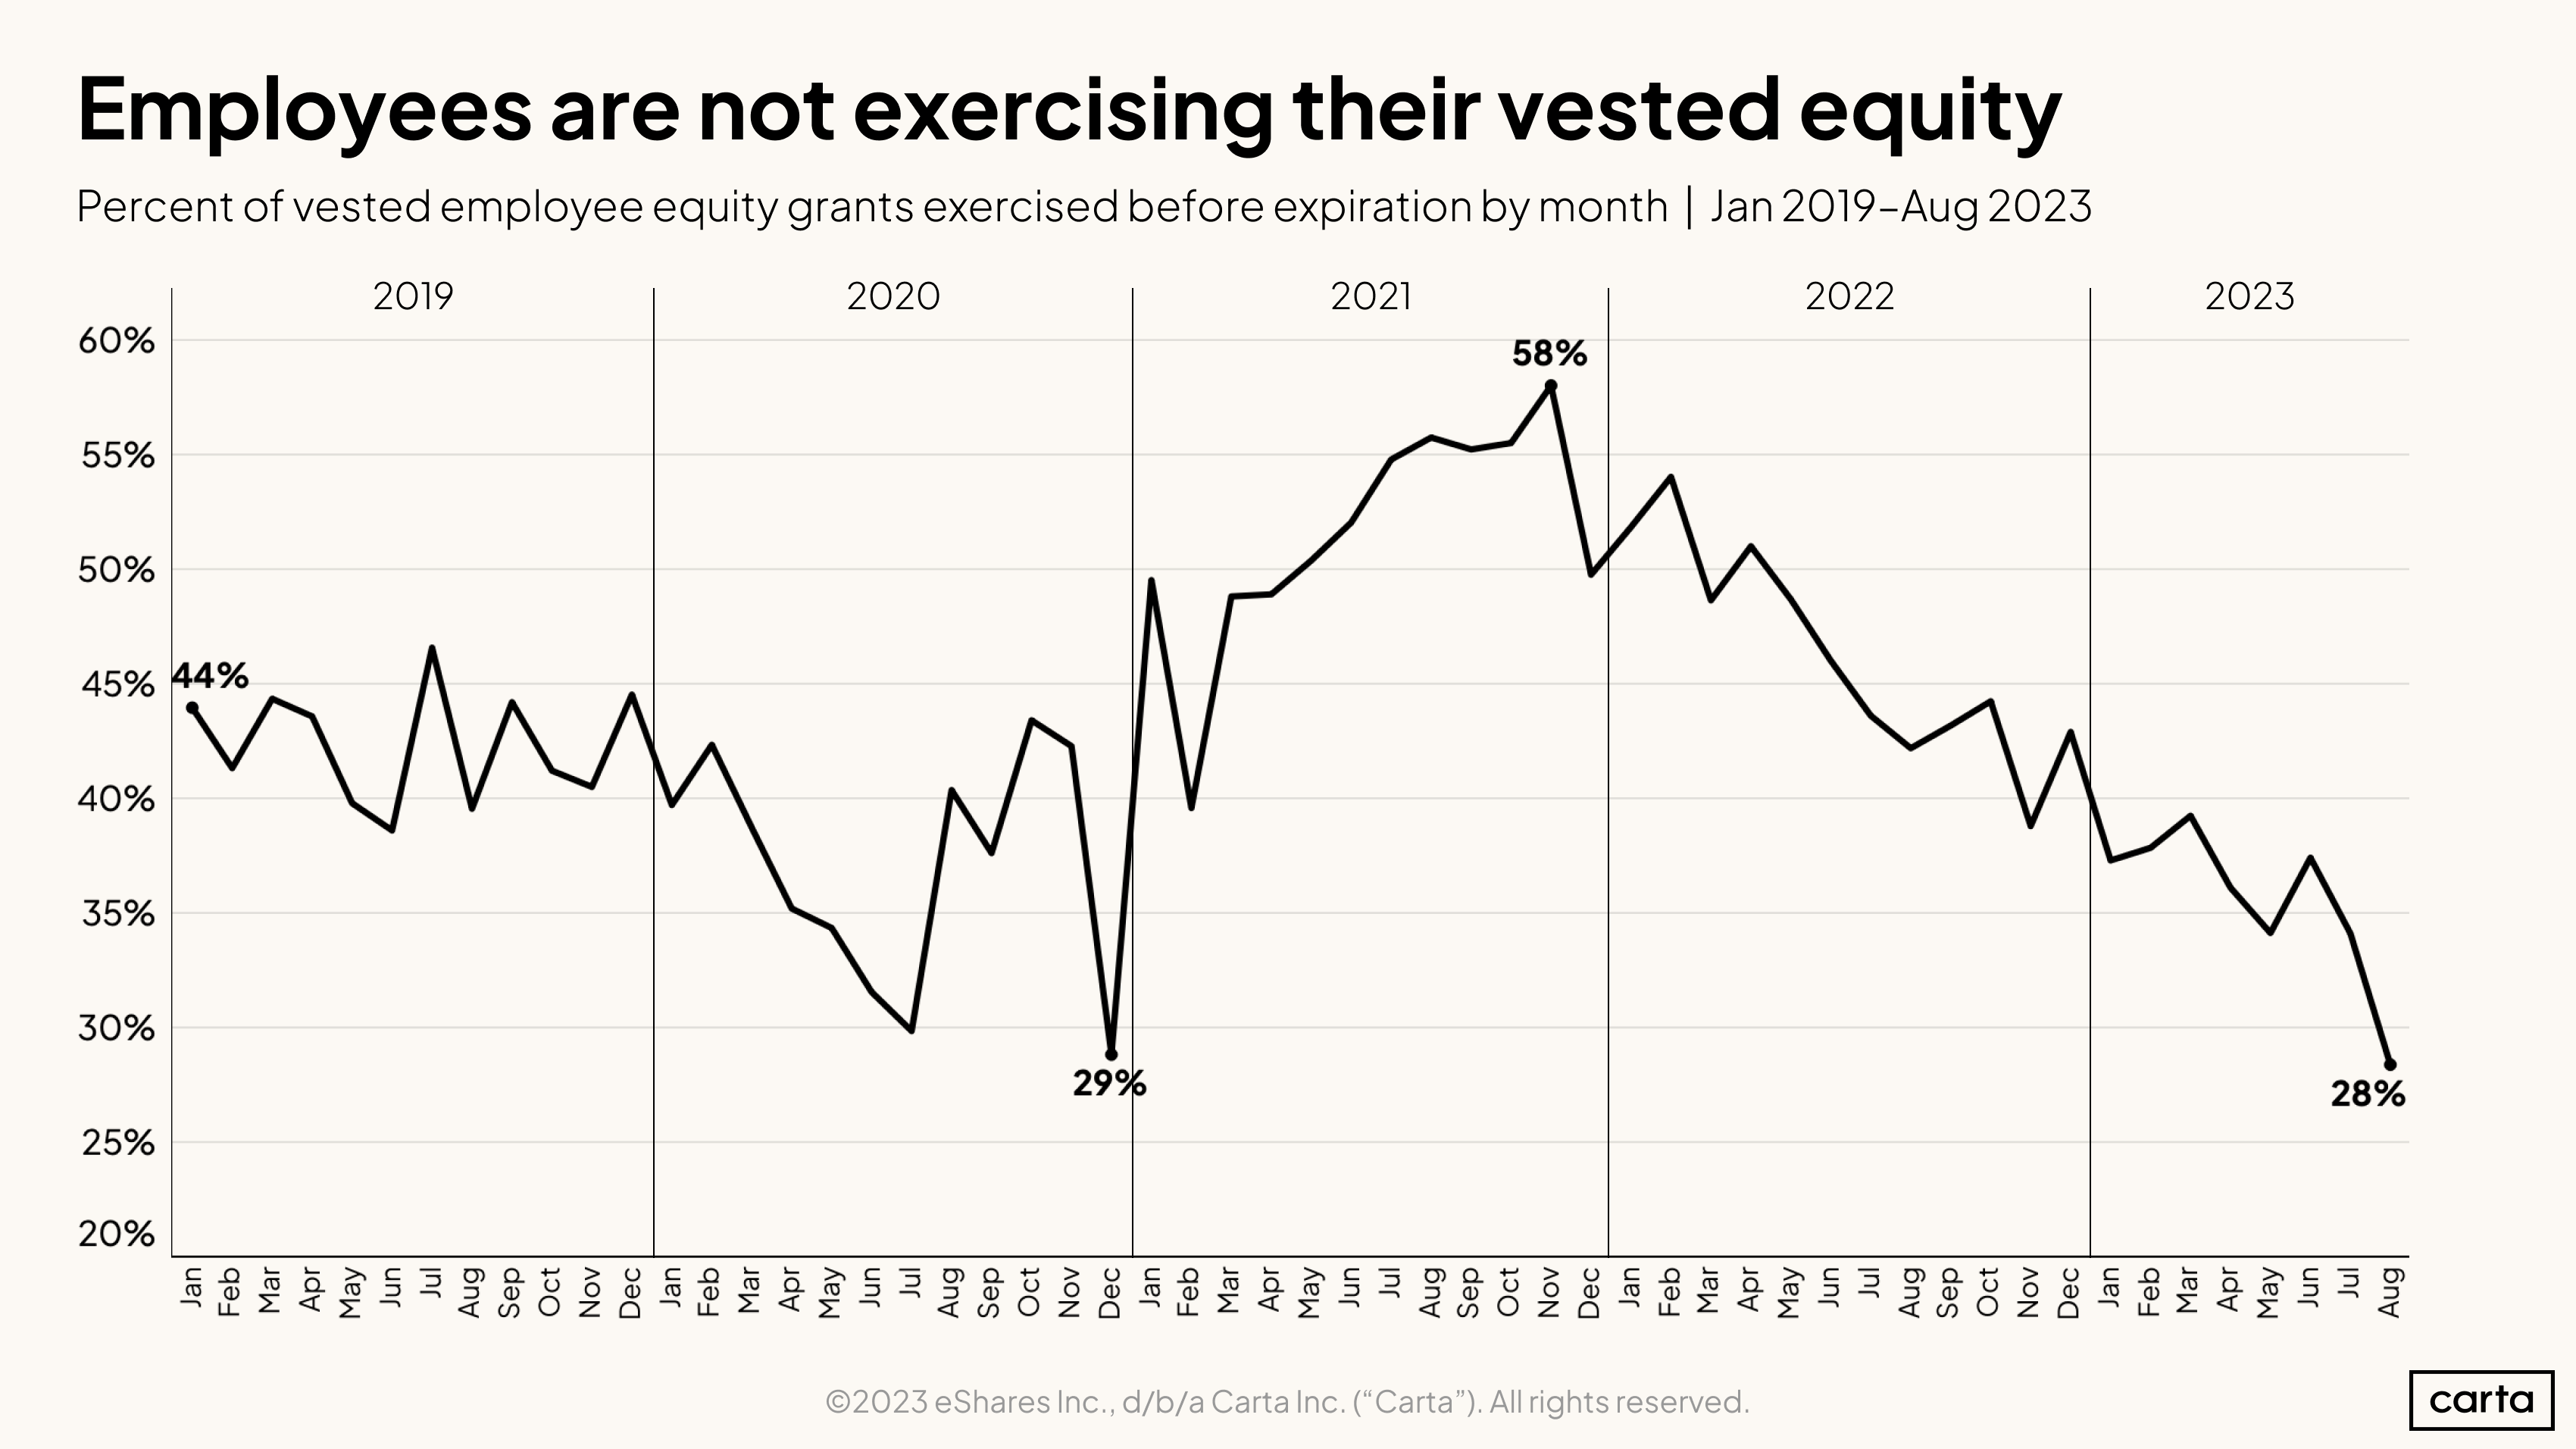
Employees are now less enthusiastic about the equity they have already vested. Only 28% of vested equity grants were exercised before expiring in August.
In most cases, startup employees receive incentive stock options (ISOs) that must be exercised in order for the employee to become a shareholder. The chart above shows that even when an employee has satisfied the time requirement to vest their options, they are increasingly unwilling to exercise those options.
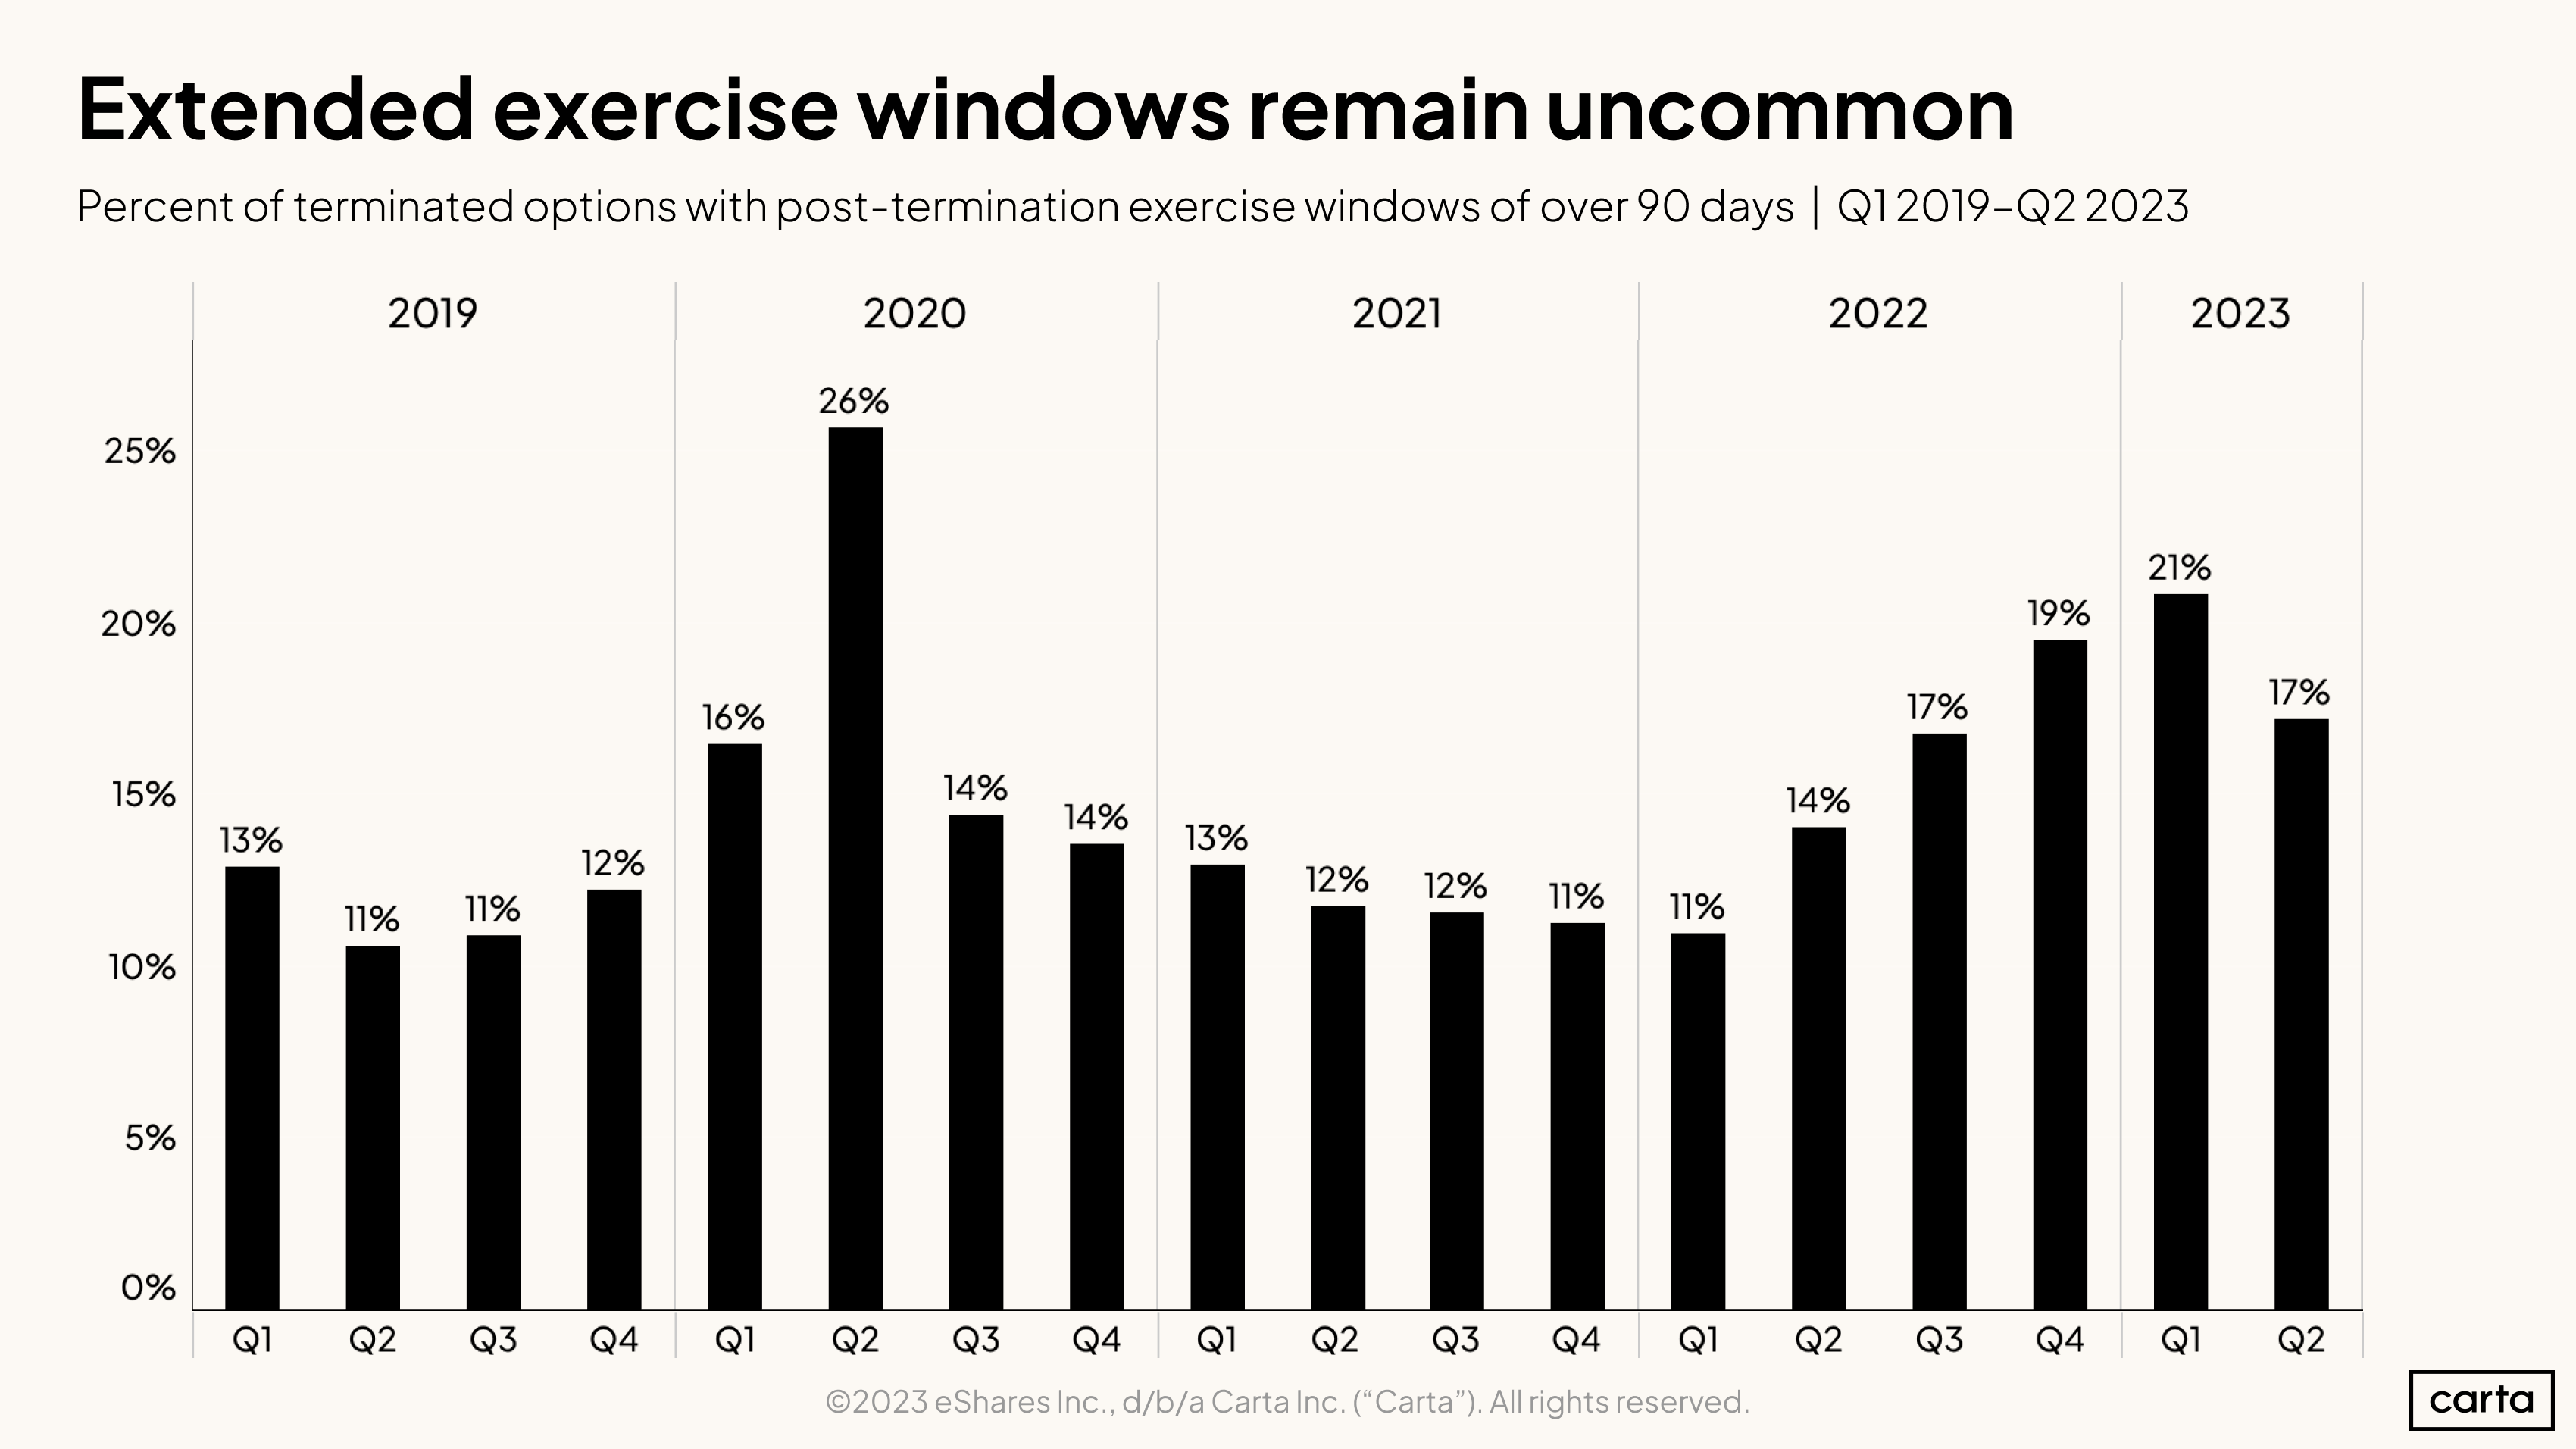
Another feature of the ISO is that once an employee leaves their company (by choice or through a layoff), generally that employee has 90 days to decide to exercise their vested options.
In high layoff environments, more employees receive extended exercise windows beyond the standard 90 days. That applied in the sharp contractions of the early pandemic and more gradually in recent quarters.
Hiring geography
Clearly, startups are being more selective about hiring and less generous with overall compensation. But what of the narratives that many companies are prioritizing candidates who can be in office? Do compensation trends show companies trying to roll back the remote work trend?
Not exactly.
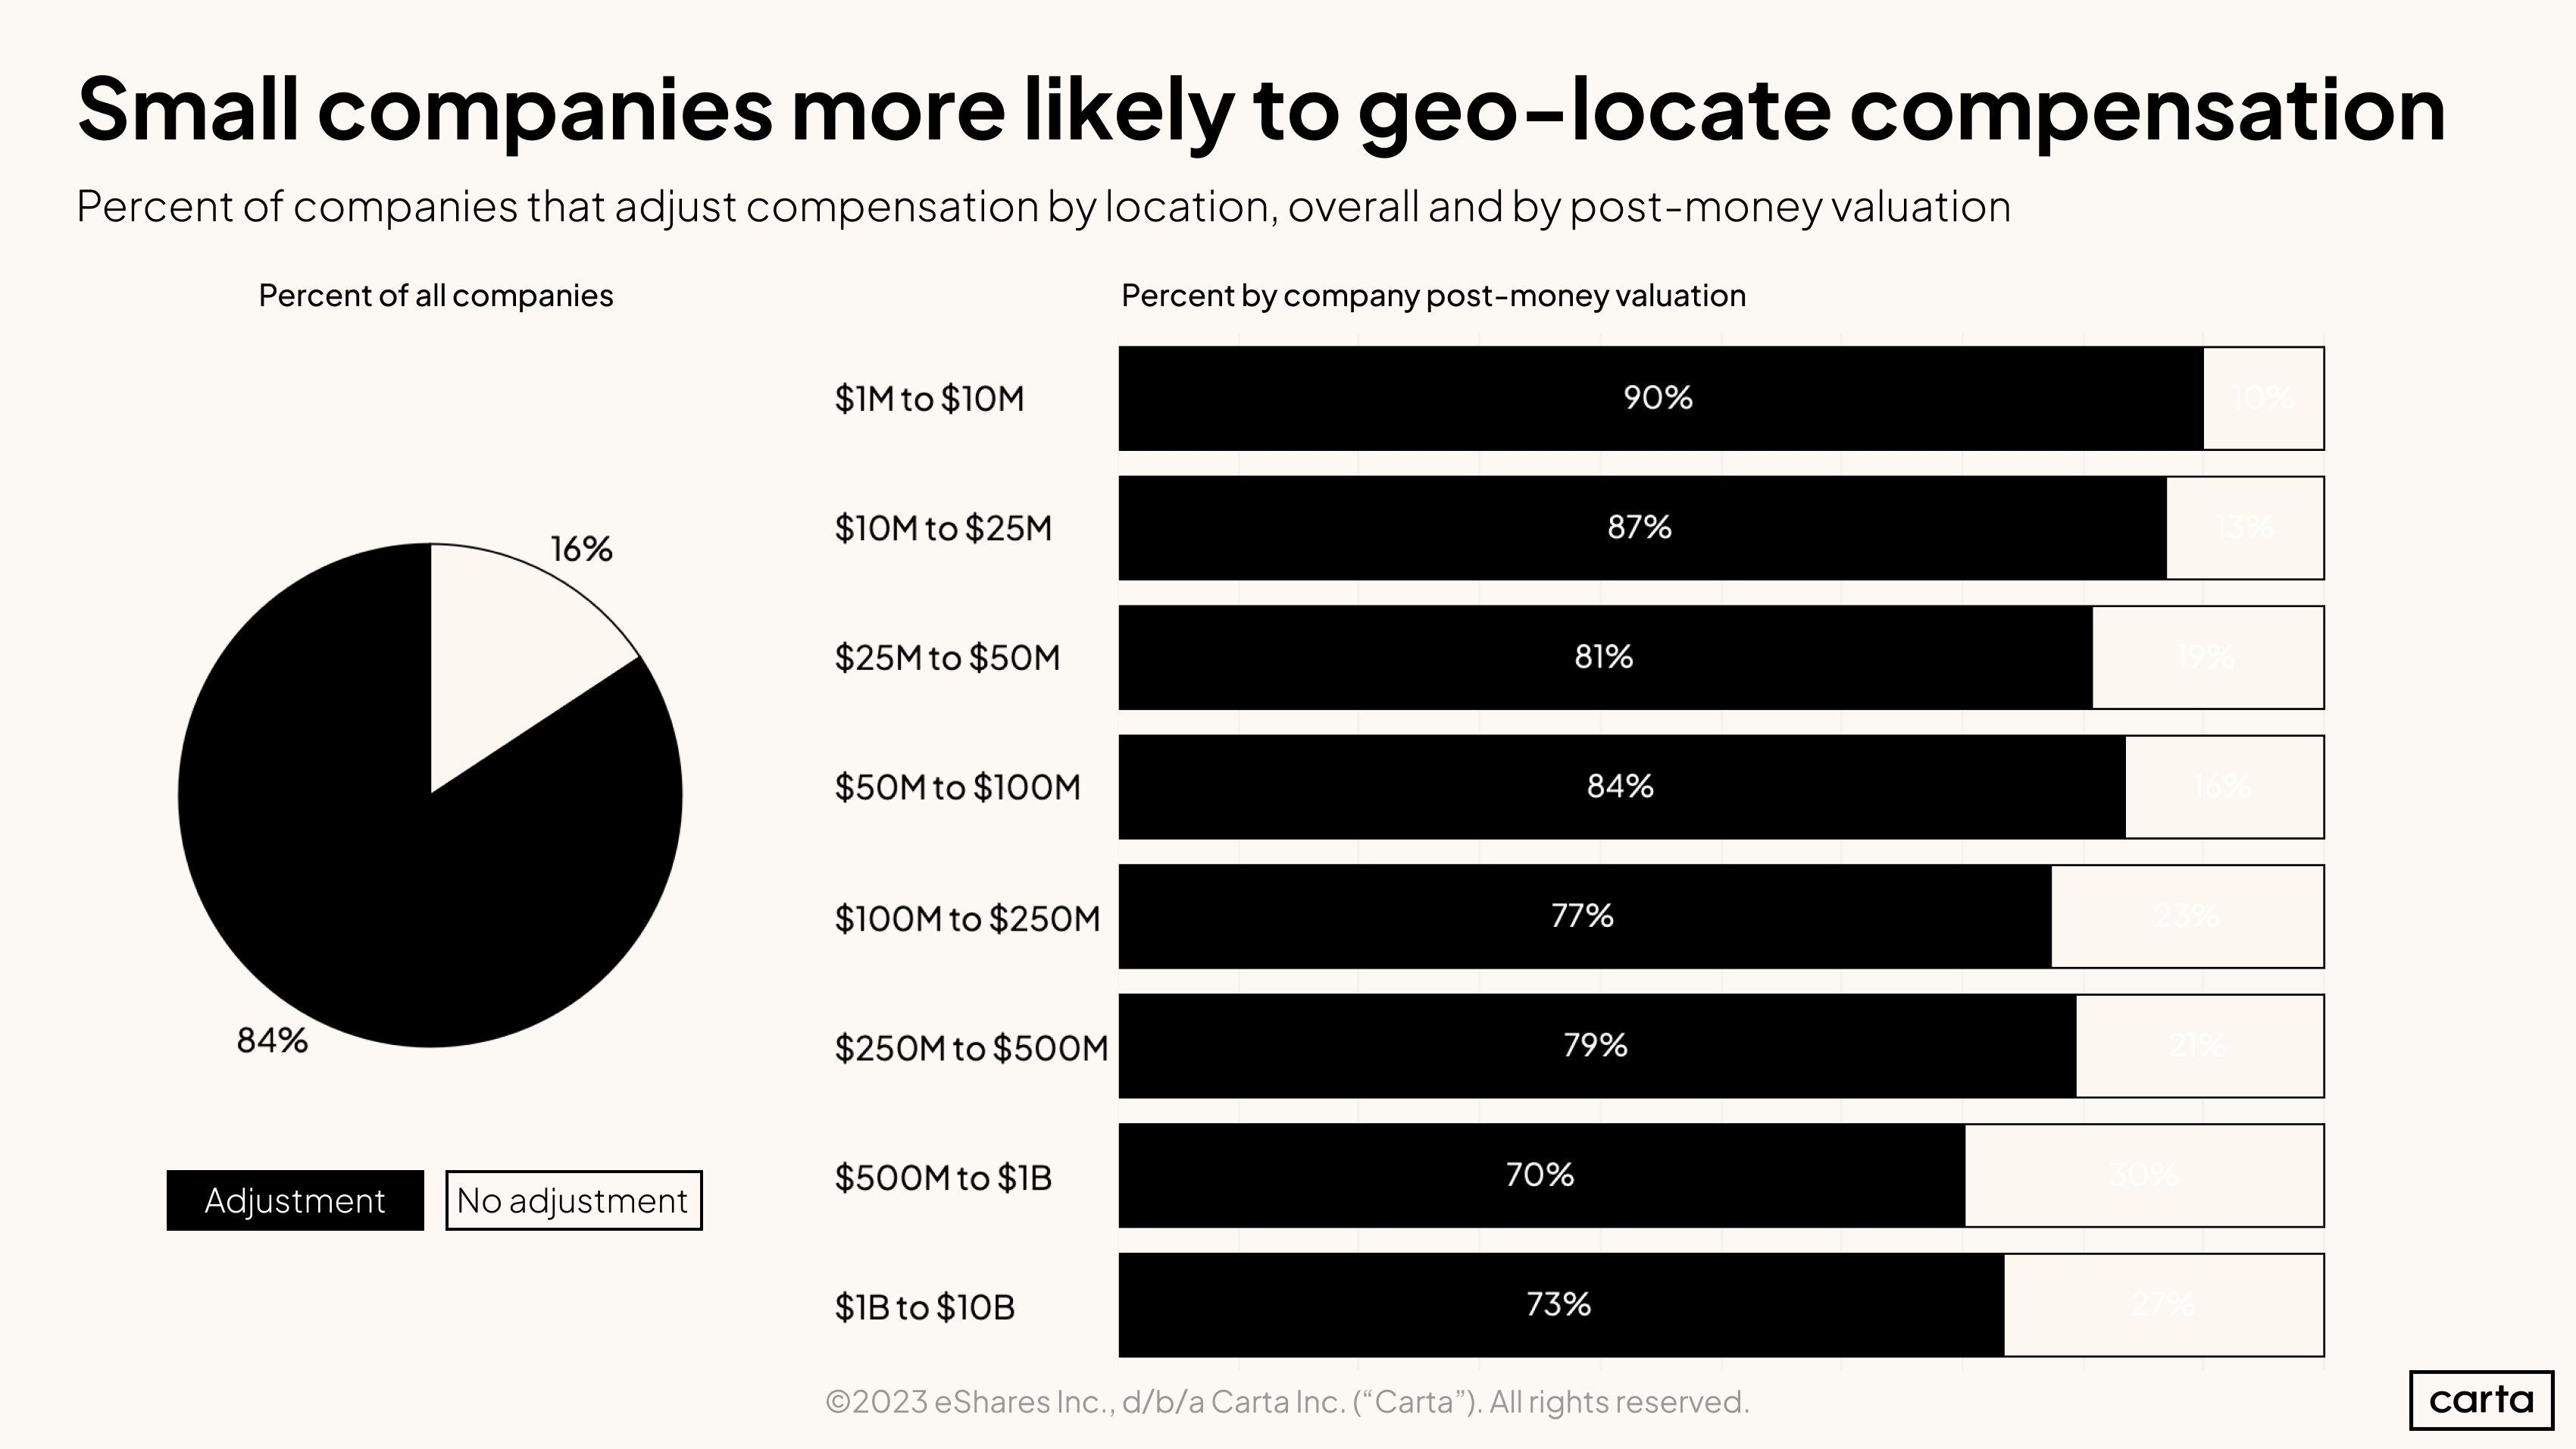
First, to dispense with a different minor narrative: Startups are still localizing compensation. Eighty-four percent of companies using Carta Total Compensation adjust an employee’s pay based on where they live.
Smaller companies are actually more likely to adjust compensation than larger startups, probably due to the need to conserve cash early in the company lifecycle.
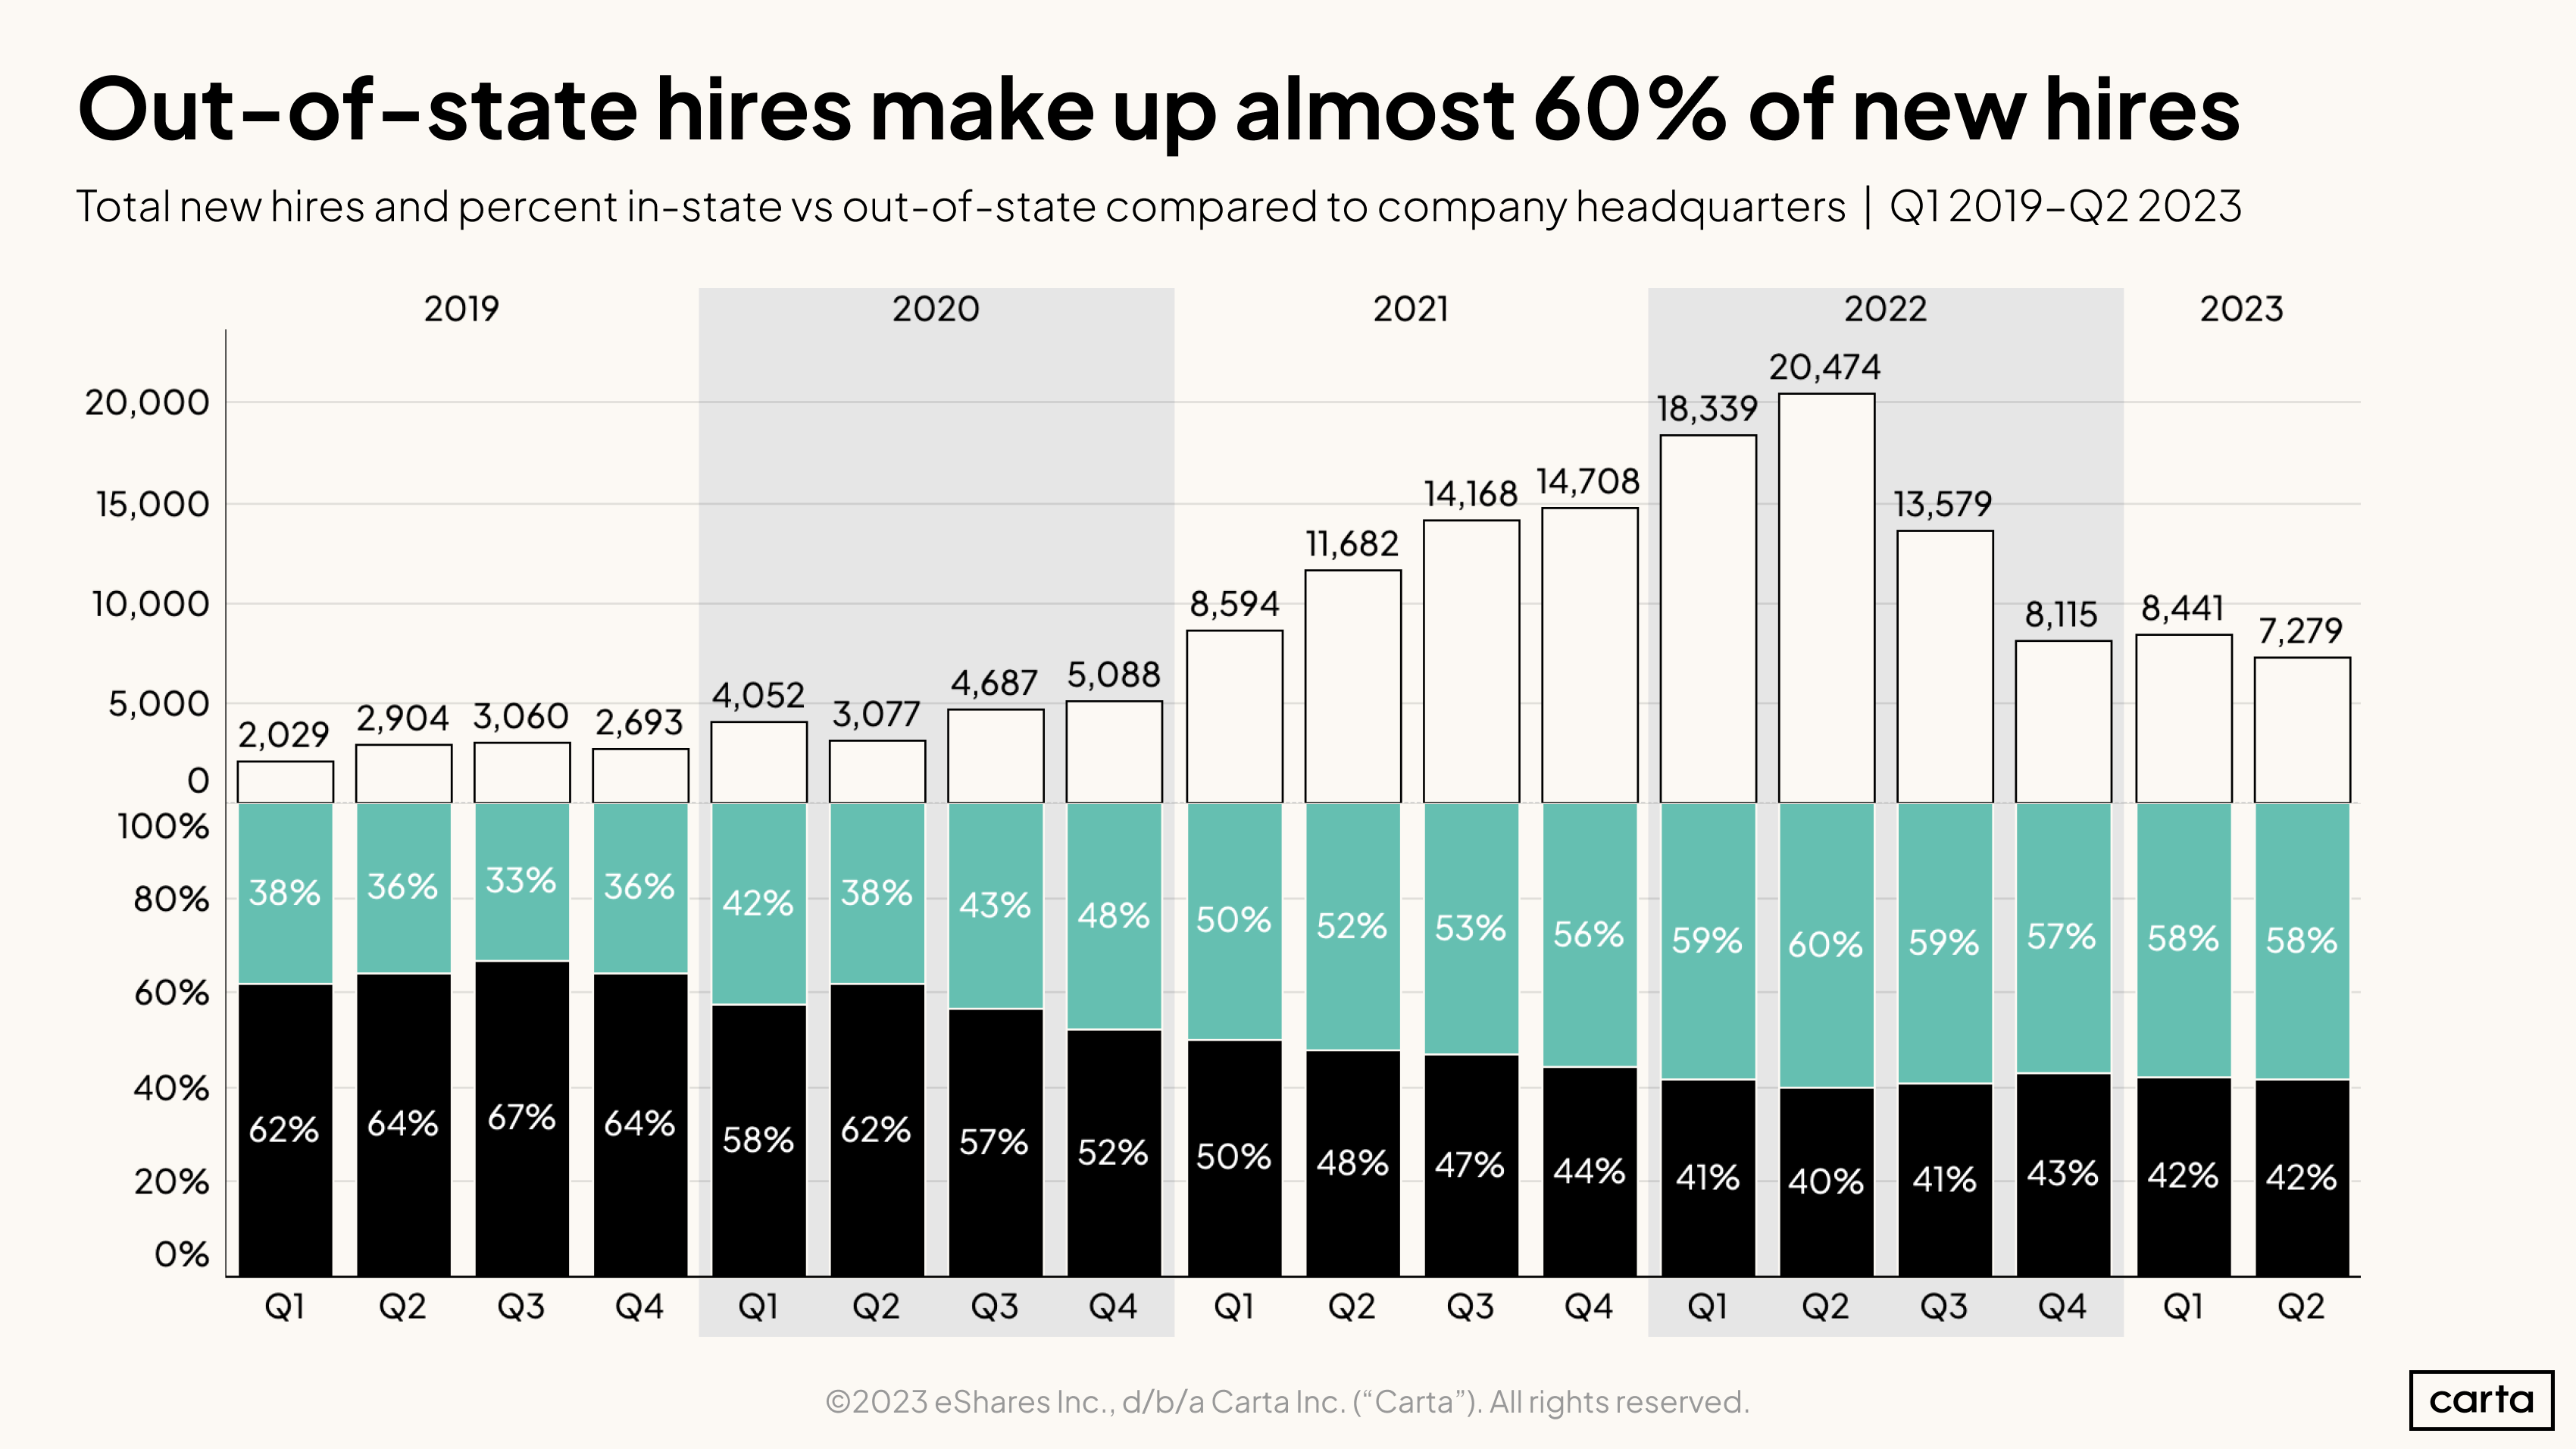
Based on the first half of 2023, startups still appear open to candidates who live far from headquarters. Fifty-eight percent of new hires in Q2 were located in a different state than the company HQ.
Of course, the chart above doesn’t exactly reflect remote hiring—more mature startups have offices in more than one state. But even if we narrow the analysis to startups worth less than $25M (and therefore unlikely to have more than one office), the percentages remain the same.
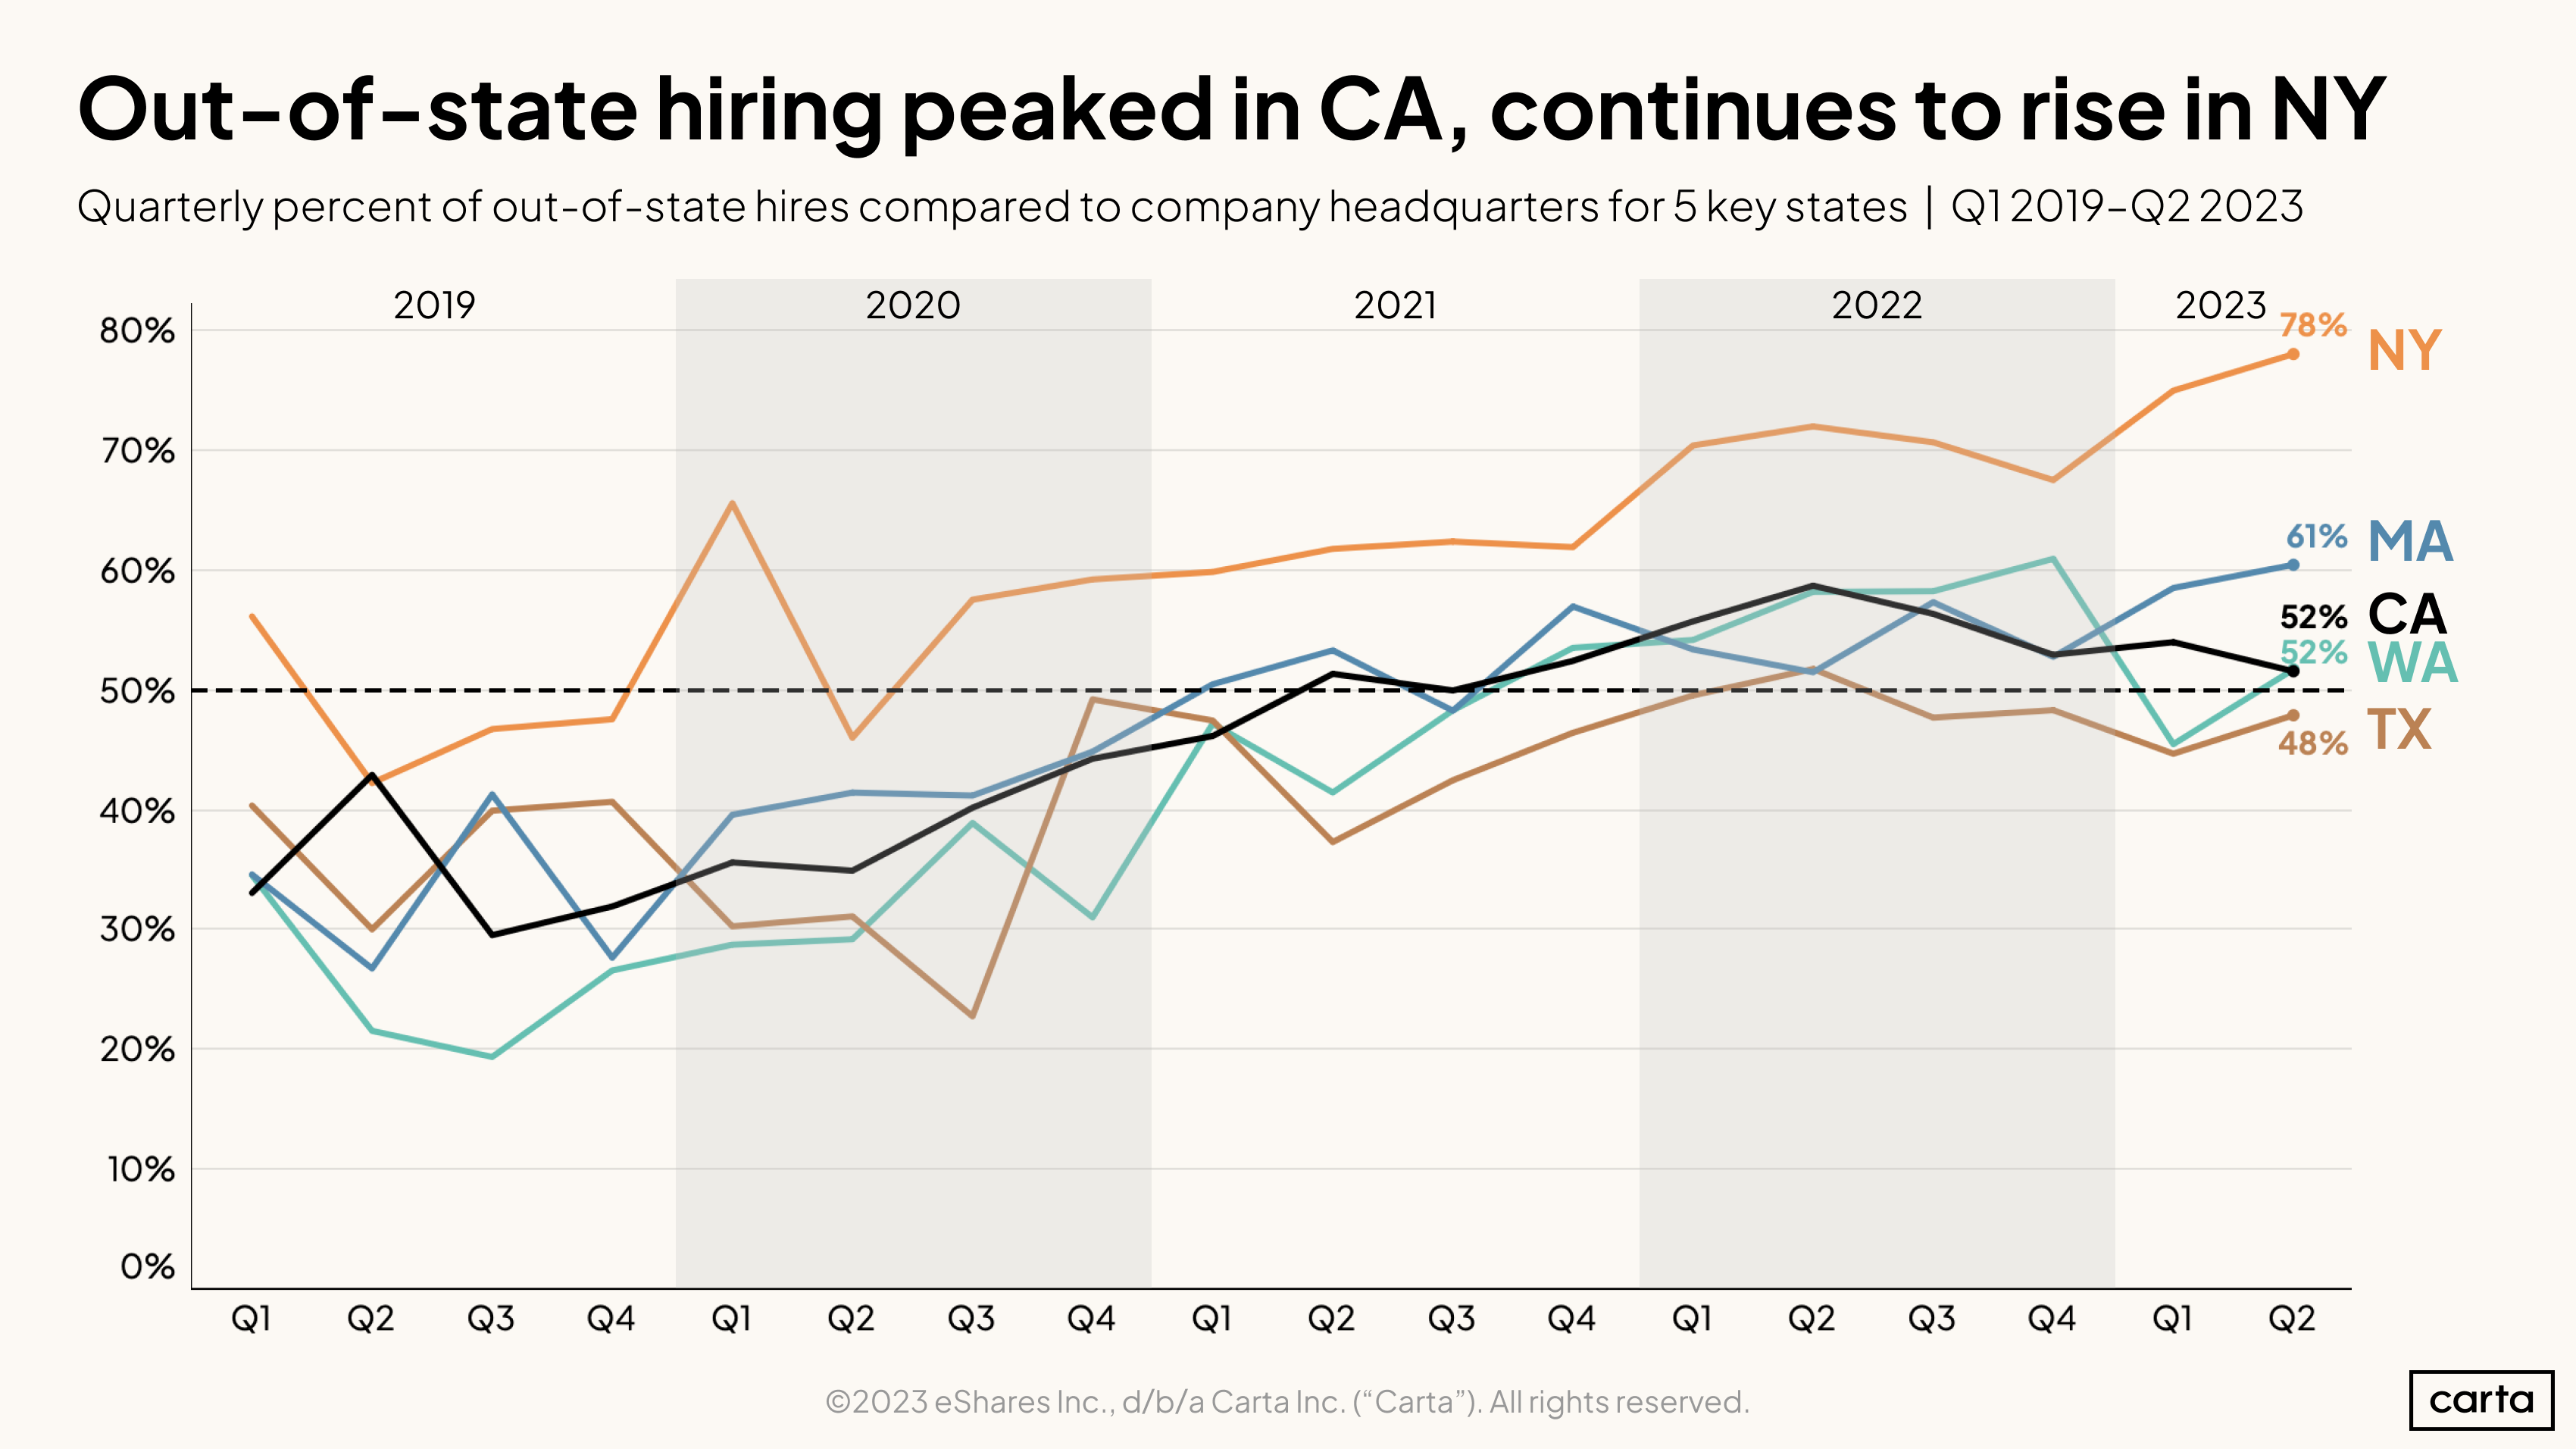
All major startup ecosystems in the U.S. saw their percentage of out-of-state hires increase over the past three years. However, a few (namely Texas and California) saw their share of out-of-state hires peak in 2022. In other states, including New York, the rate kept climbing. Less than half of new hires for Texas startups in 2023 live outside of Texas, whereas three out of four new employees for New York startups live somewhere other than New York.
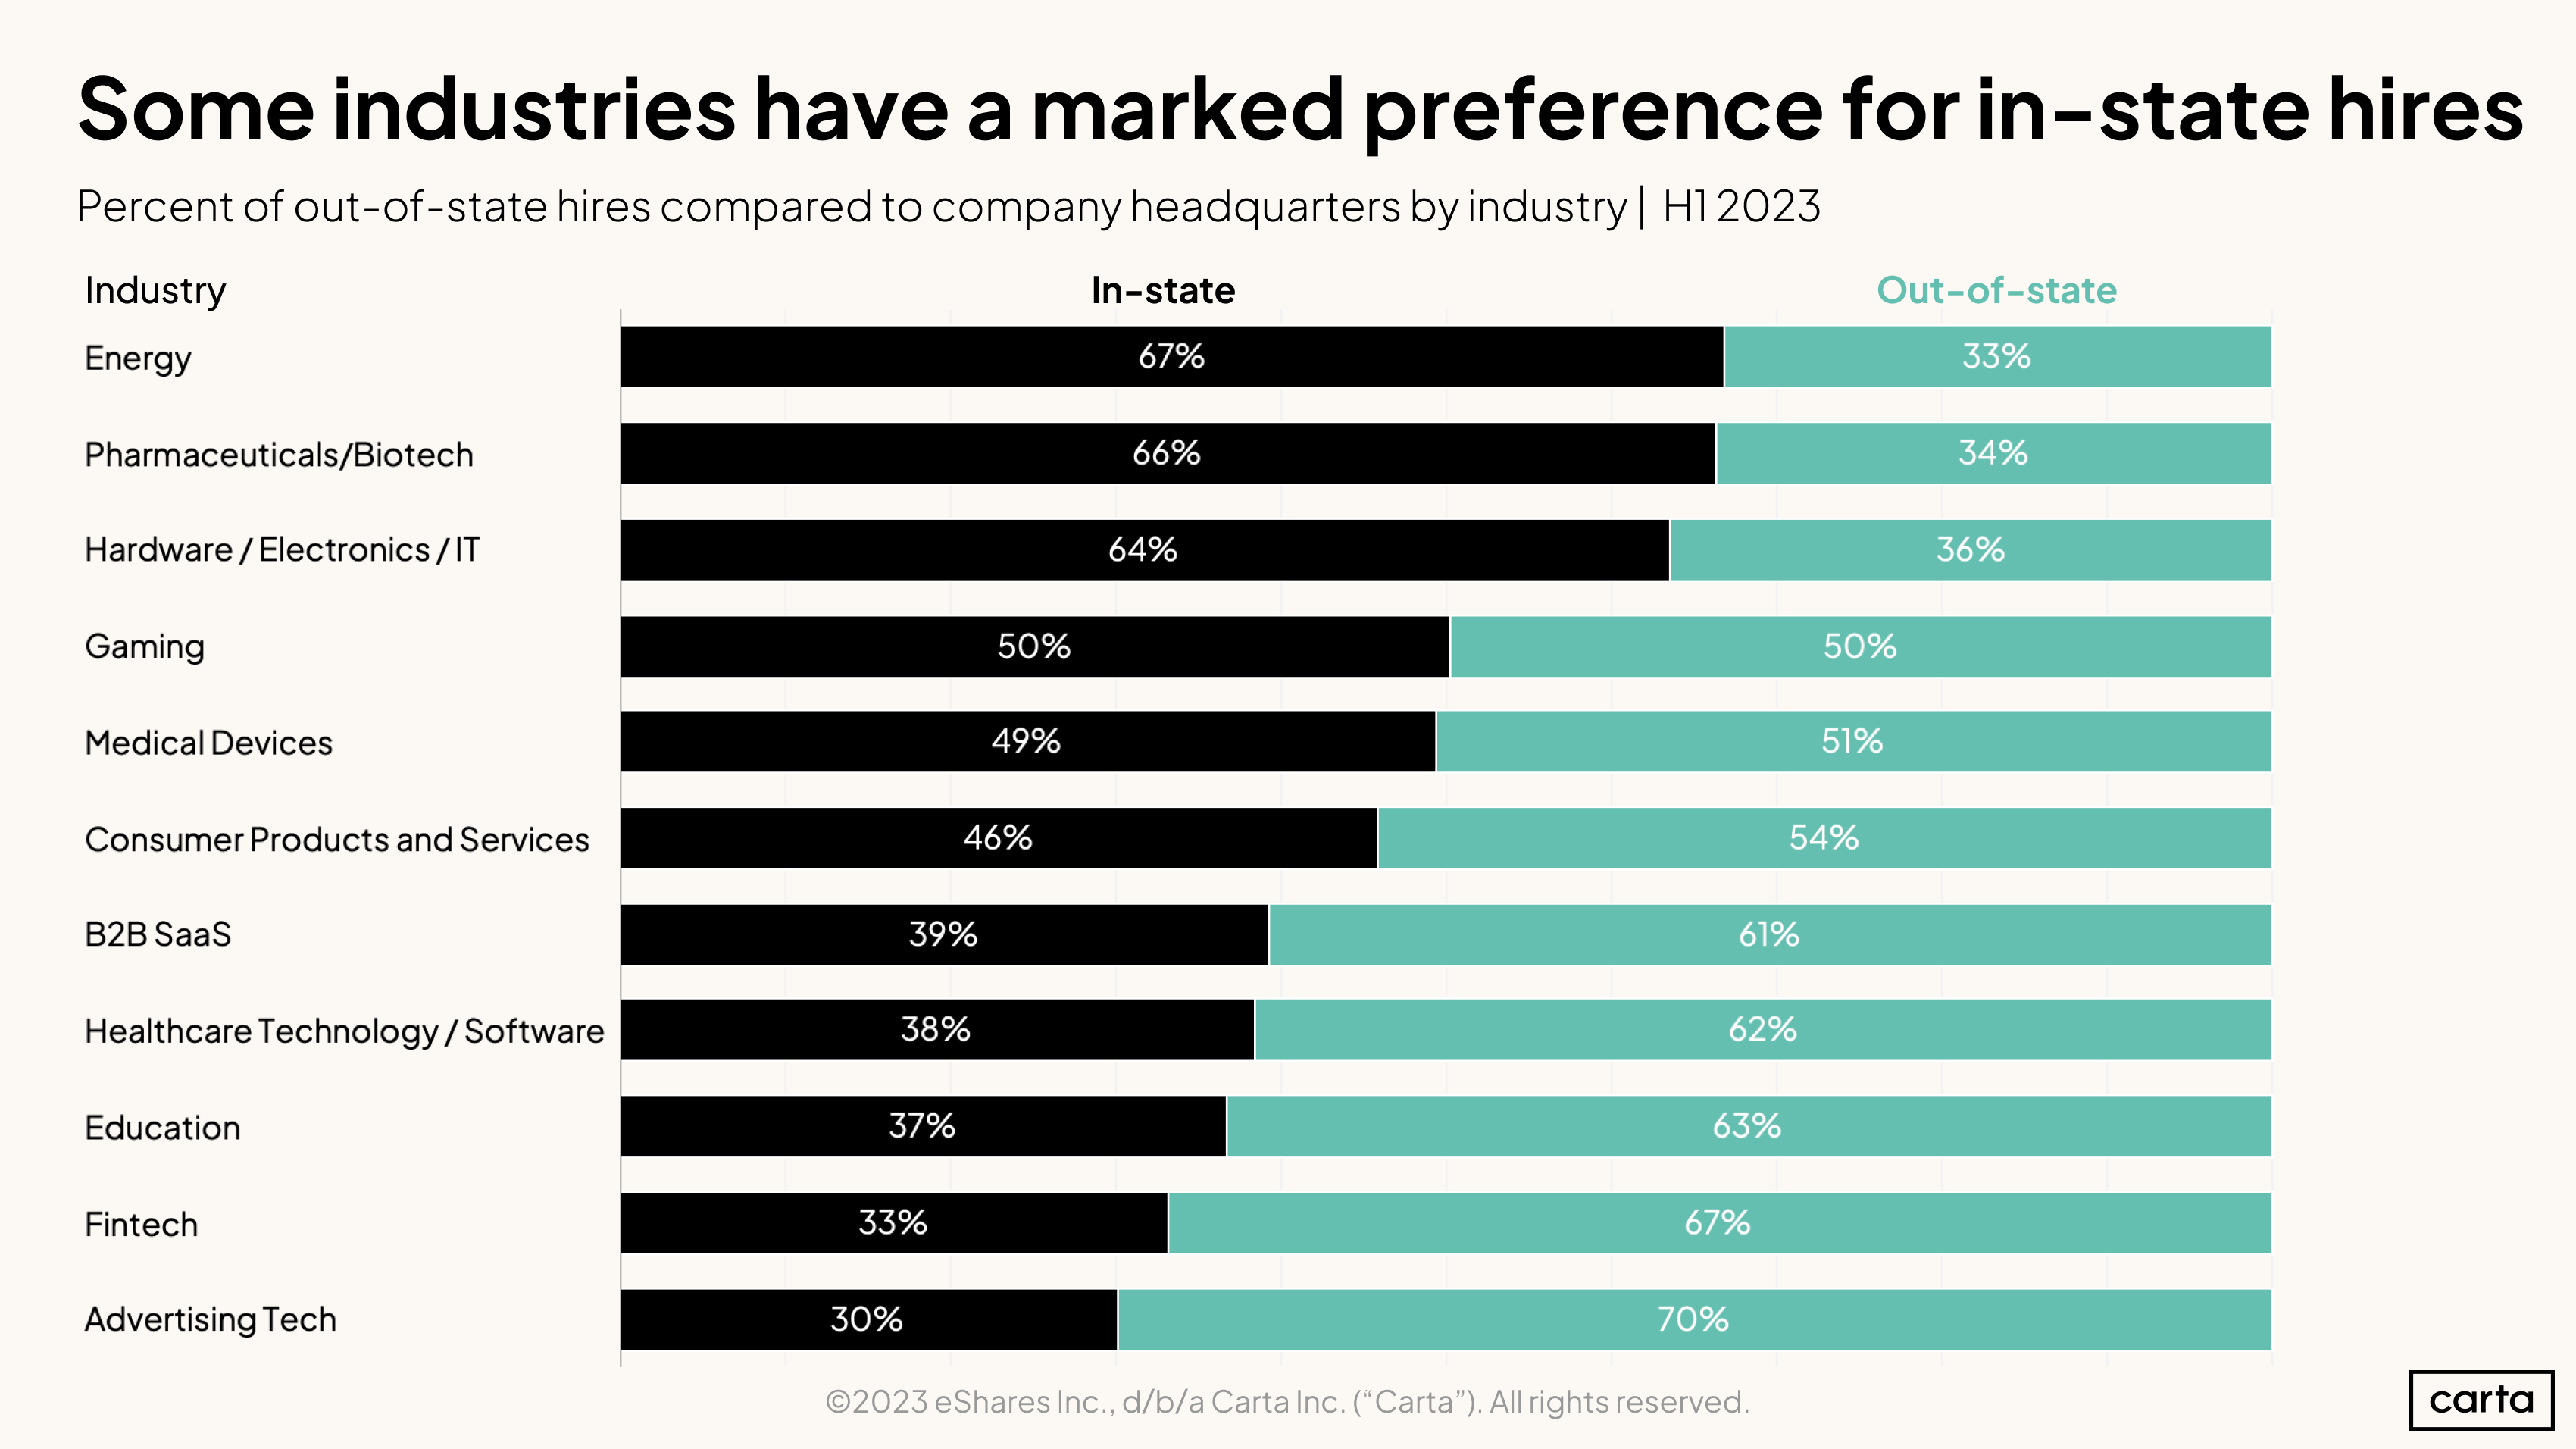
Certain startup industries have remained immune to the charms of location-agnostic hiring. So far in 2023, two-thirds of new hires in energy, pharma/biotech, and hardware startups have been in-state candidates.
Compensation by city
Decisions around hiring local or remote talent have many considerations—but relative pay based on location is clearly a major factor.
At a high level, cities across the U.S. have continued to see compensation for startup employees drift towards San Francisco levels. Twenty-six of 50 tracked metro areas saw average compensation (expressed as a percentage of SF rates) rise from 2022 to 2023.
However, these benchmarks only reflect pay levels between metro areas and do not speak to the distinctions in cost-of-living.
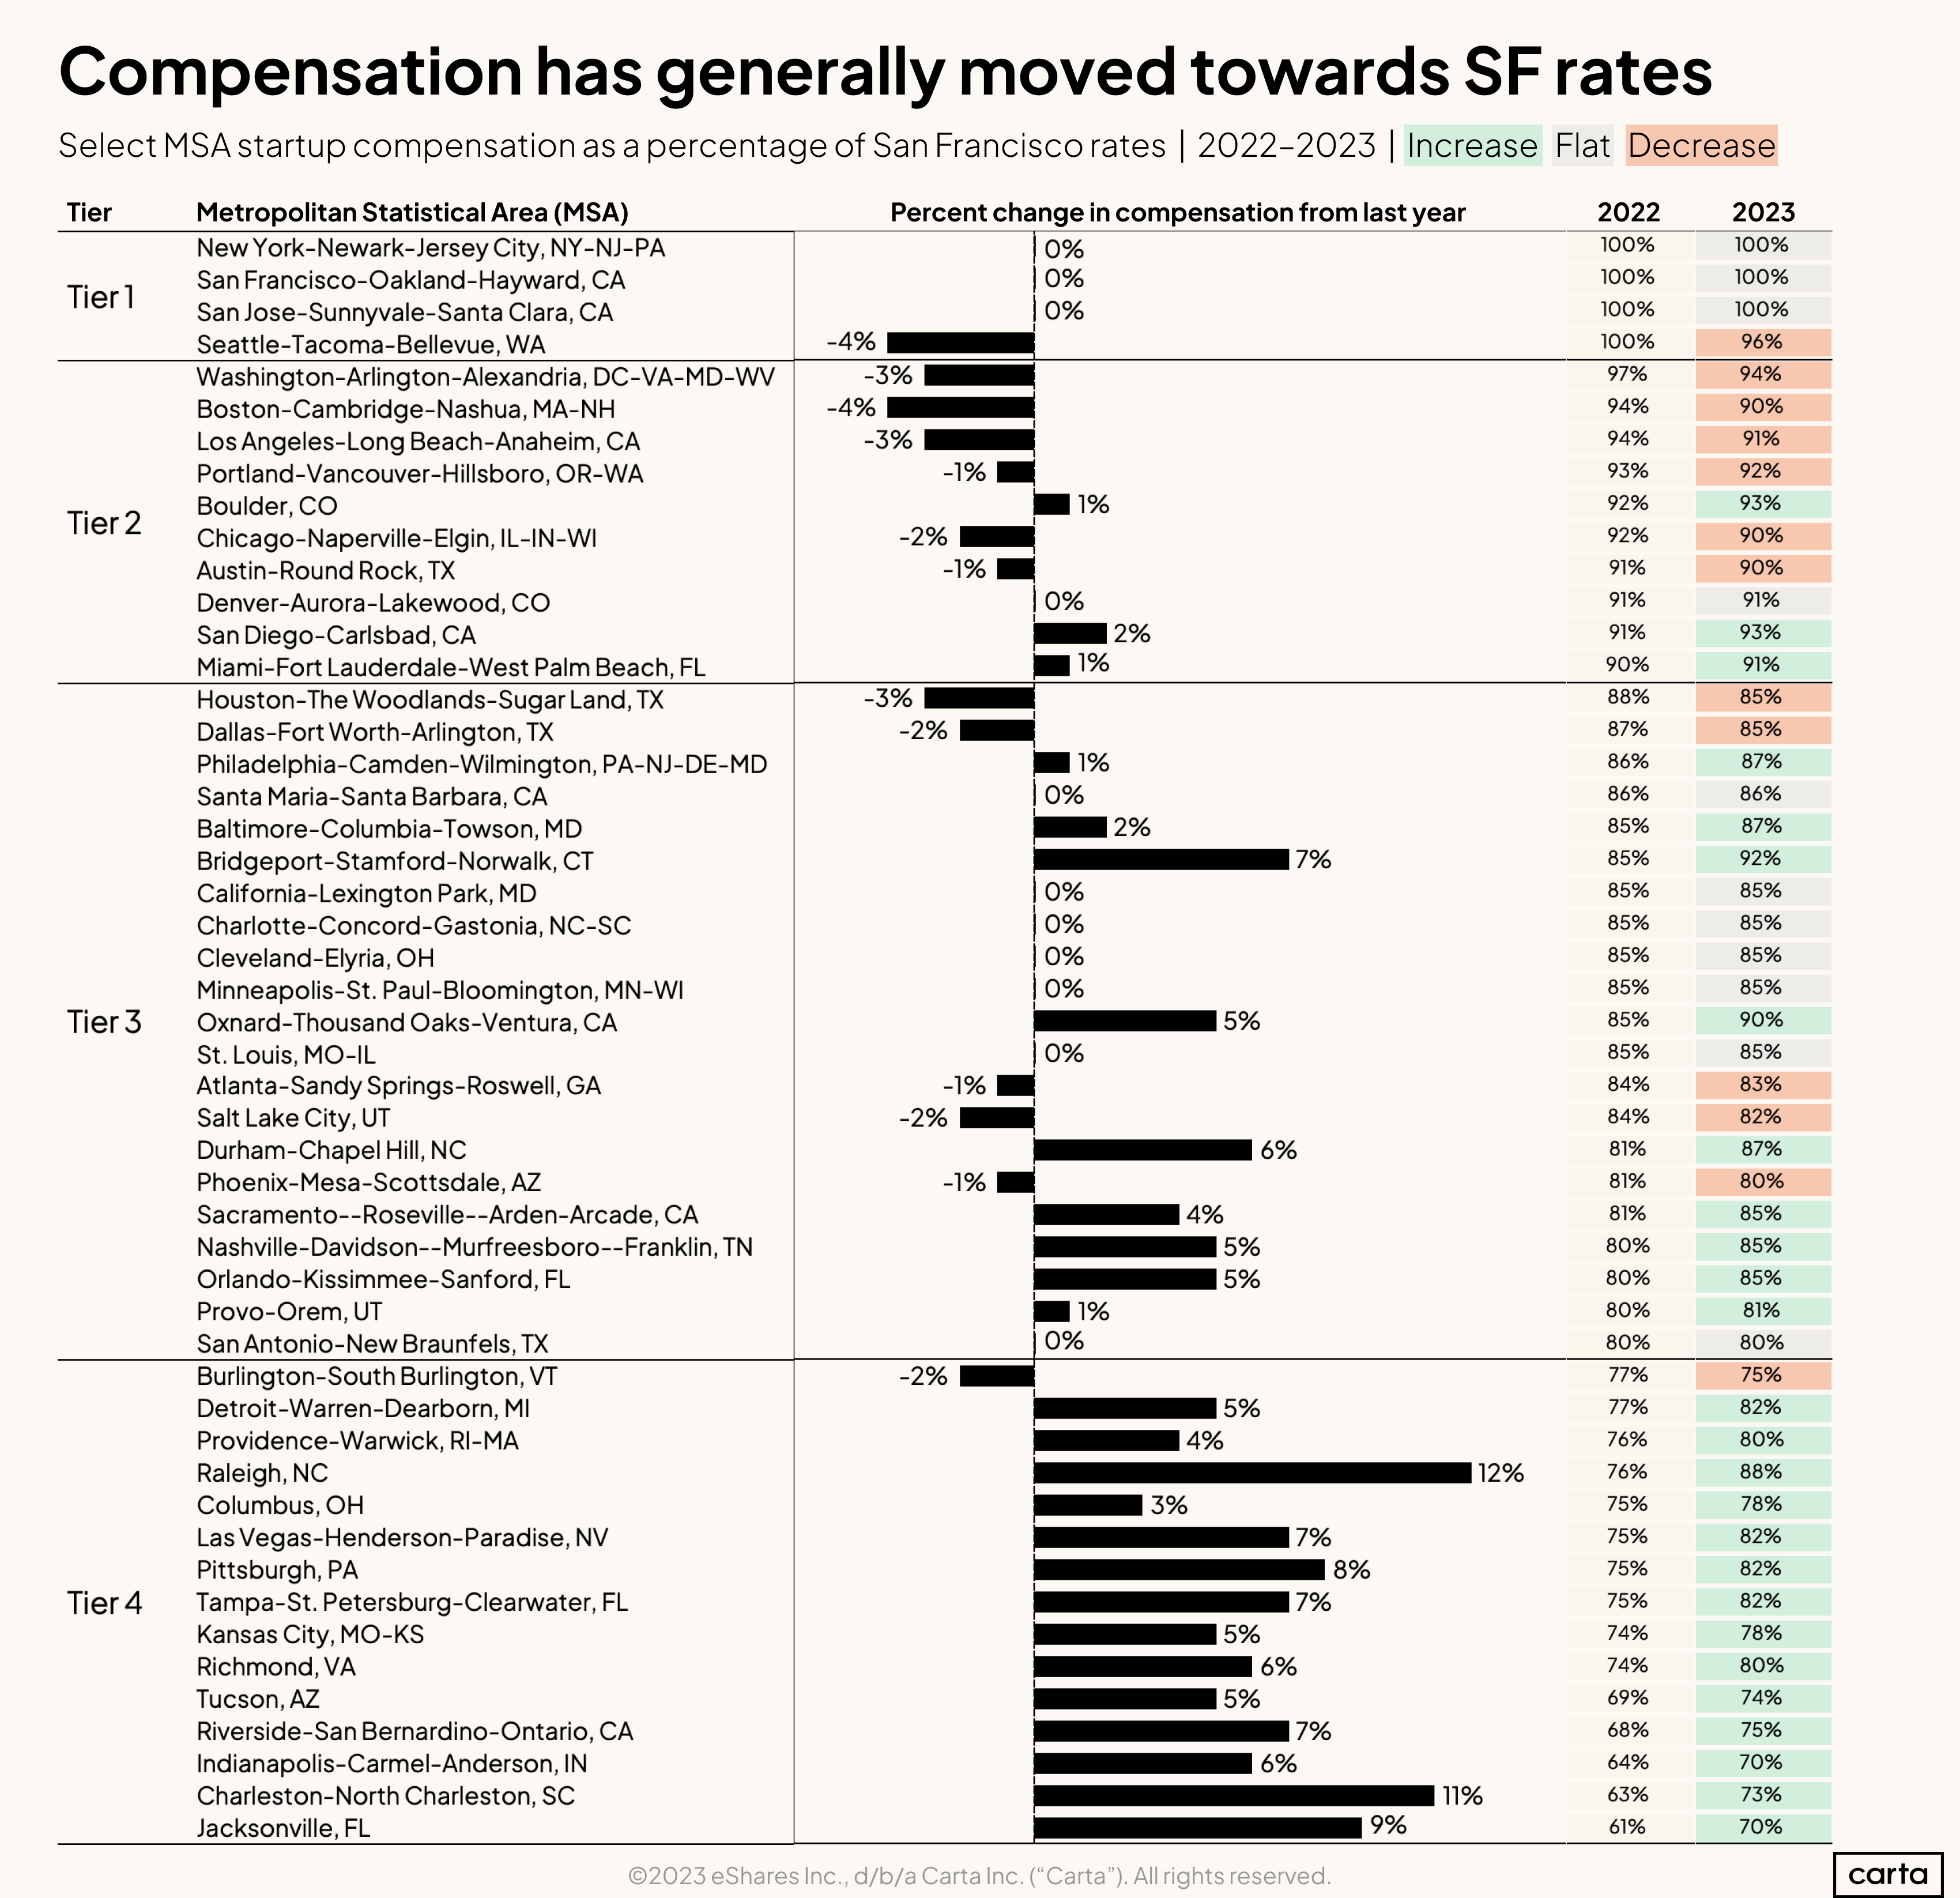
In the graphic above, the tier of each metro area is defined by the compensation level relative to San Francisco in 2022. Tier 2 cities, for instance, had comp levels ranging from 90%-99% of SF. Tier 3 was 80%-89% and Tier 4 was 79% or below.
Movement over the past year has been most rapid among the Tier 4 cities. Raleigh NC, Charleston SC, and Pittsburgh PA all saw average compensation gains of 8% or more relative to San Francisco.
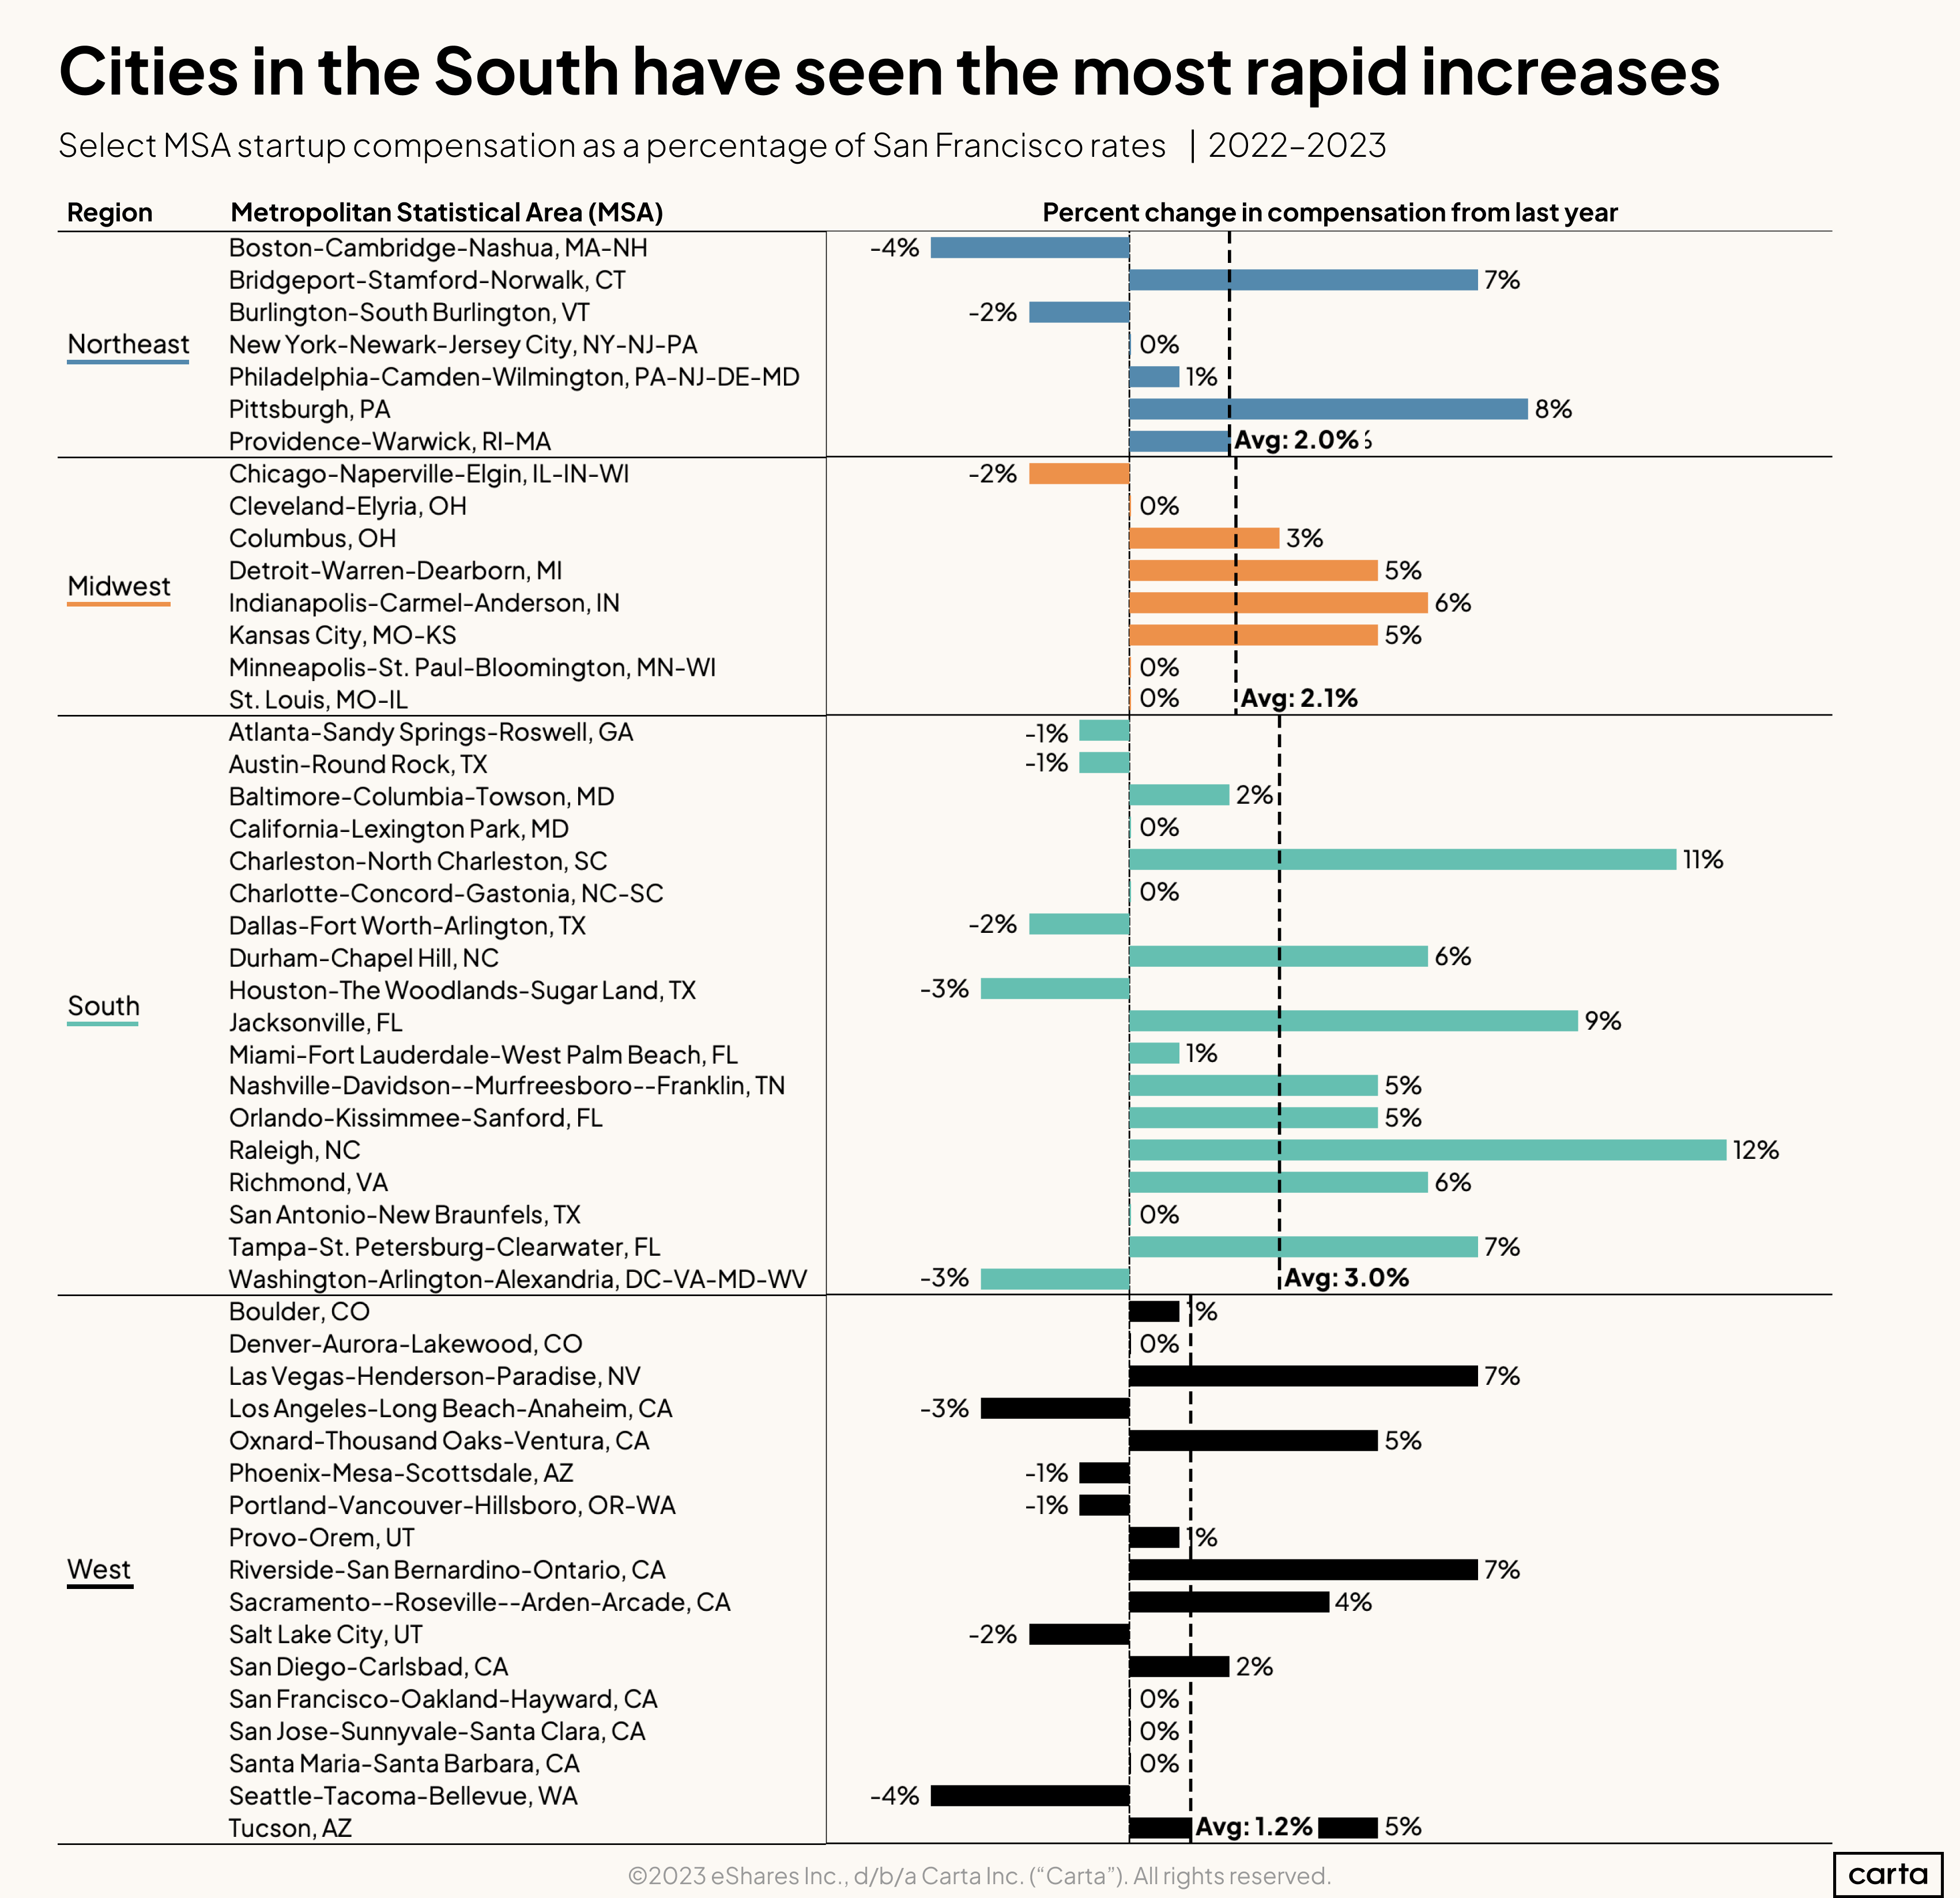
Startup employees in the South have seen the most relative gains in compensation over the past year, with metro areas in that region rising on average 3% closer to San Francisco pay.
Equity compensation addendum
Download the equity addendum below to see:
Employee option pool sizes by valuation
Median advisory shares for pre-seed, seed, and Series A companies
Median equity grants for a startup’s first 10 employees
Median equity grants for startup board members at the early stages
Suggested adjustments to San Francisco equity rates for 20 countries
Methodology
Overall dataset
Carta helps more than 3,000 venture-backed companies practice fair compensation using Carta Total Compensation. The data presented above represents an aggregated, anonymized view into the pay strategies of these startups. Collectively, Carta Total Comp companies employ more than 280,000 employees. Companies that have contractually requested that we not use their data in anonymized and aggregated studies are not included in this analysis. Carta does not sell customer data of any kind.
The data presented in this report represents a snapshot as of August 15th, 2023. Historical data may change in future studies. New companies signing up for Carta’s services will increase the amount of data available for the report.
Location analysis
All metro analysis in this report uses metropolitan statistical areas, or MSAs, as the geographic unit. We included metro areas for which Carta Total Compensation has sufficient density of employees to make reasonable determinations as to the relative level of compensation.
Salary & equity
All salaries presented in this report are expressed in U.S. dollars. Except where indicated, total payroll numbers do not include any variable compensation, such as bonuses or commissions, that may be given to employees.
All equity values presented in this report are expressed as a percentage of fully diluted company shares.
In the sections on salary and equity trends, changes over time reflect updates to Carta Total Compensation bands. These benchmarks are updated once per quarter to incorporate newly hired employee data as well as any adjustments to current employee compensation.

DISCLOSURE: This communication is on behalf of eShares Inc., d/b/a Carta Inc. ("Carta"). This communication is for informational purposes only, and contains general information only. Carta is not, by means of this communication, rendering accounting, business, financial, investment, legal, tax, or other professional advice or services. This publication is not a substitute for such professional advice or services nor should it be used as a basis for any decision or action that may affect your business or interests. Before making any decision or taking any action that may affect your business or interests, you should consult a qualified professional advisor. This communication is not intended as a recommendation, offer or solicitation for the purchase or sale of any security. Carta does not assume any liability for reliance on the information provided herein. ©2023 eShares Inc., d/b/a Carta Inc. ("Carta"). All rights reserved. Reproduction prohibited.