- How far do startup salaries stretch outside SF? A city-by-city guide
- Pay differentials across top-paying startup metros
- Startup salaries vs. cost of living
- How cost of living impacts startup salaries
- San Francisco vs. Chicago
- San Francisco vs. Cleveland
- Salary–cost index (SCI)
- Methodology
- Learn more
- Get compensation insights in your inbox
How much do startup employees reallyearn? It depends on where they live.
Private companies pay the highest salaries in San Francisco, San Jose, Seattle, and New York, according to Carta’s latest look at the state of startup compensation. But many other cities aren’t far off. Base salaries in more than two dozen other metro areas are at least 80% of what they are in San Francisco.
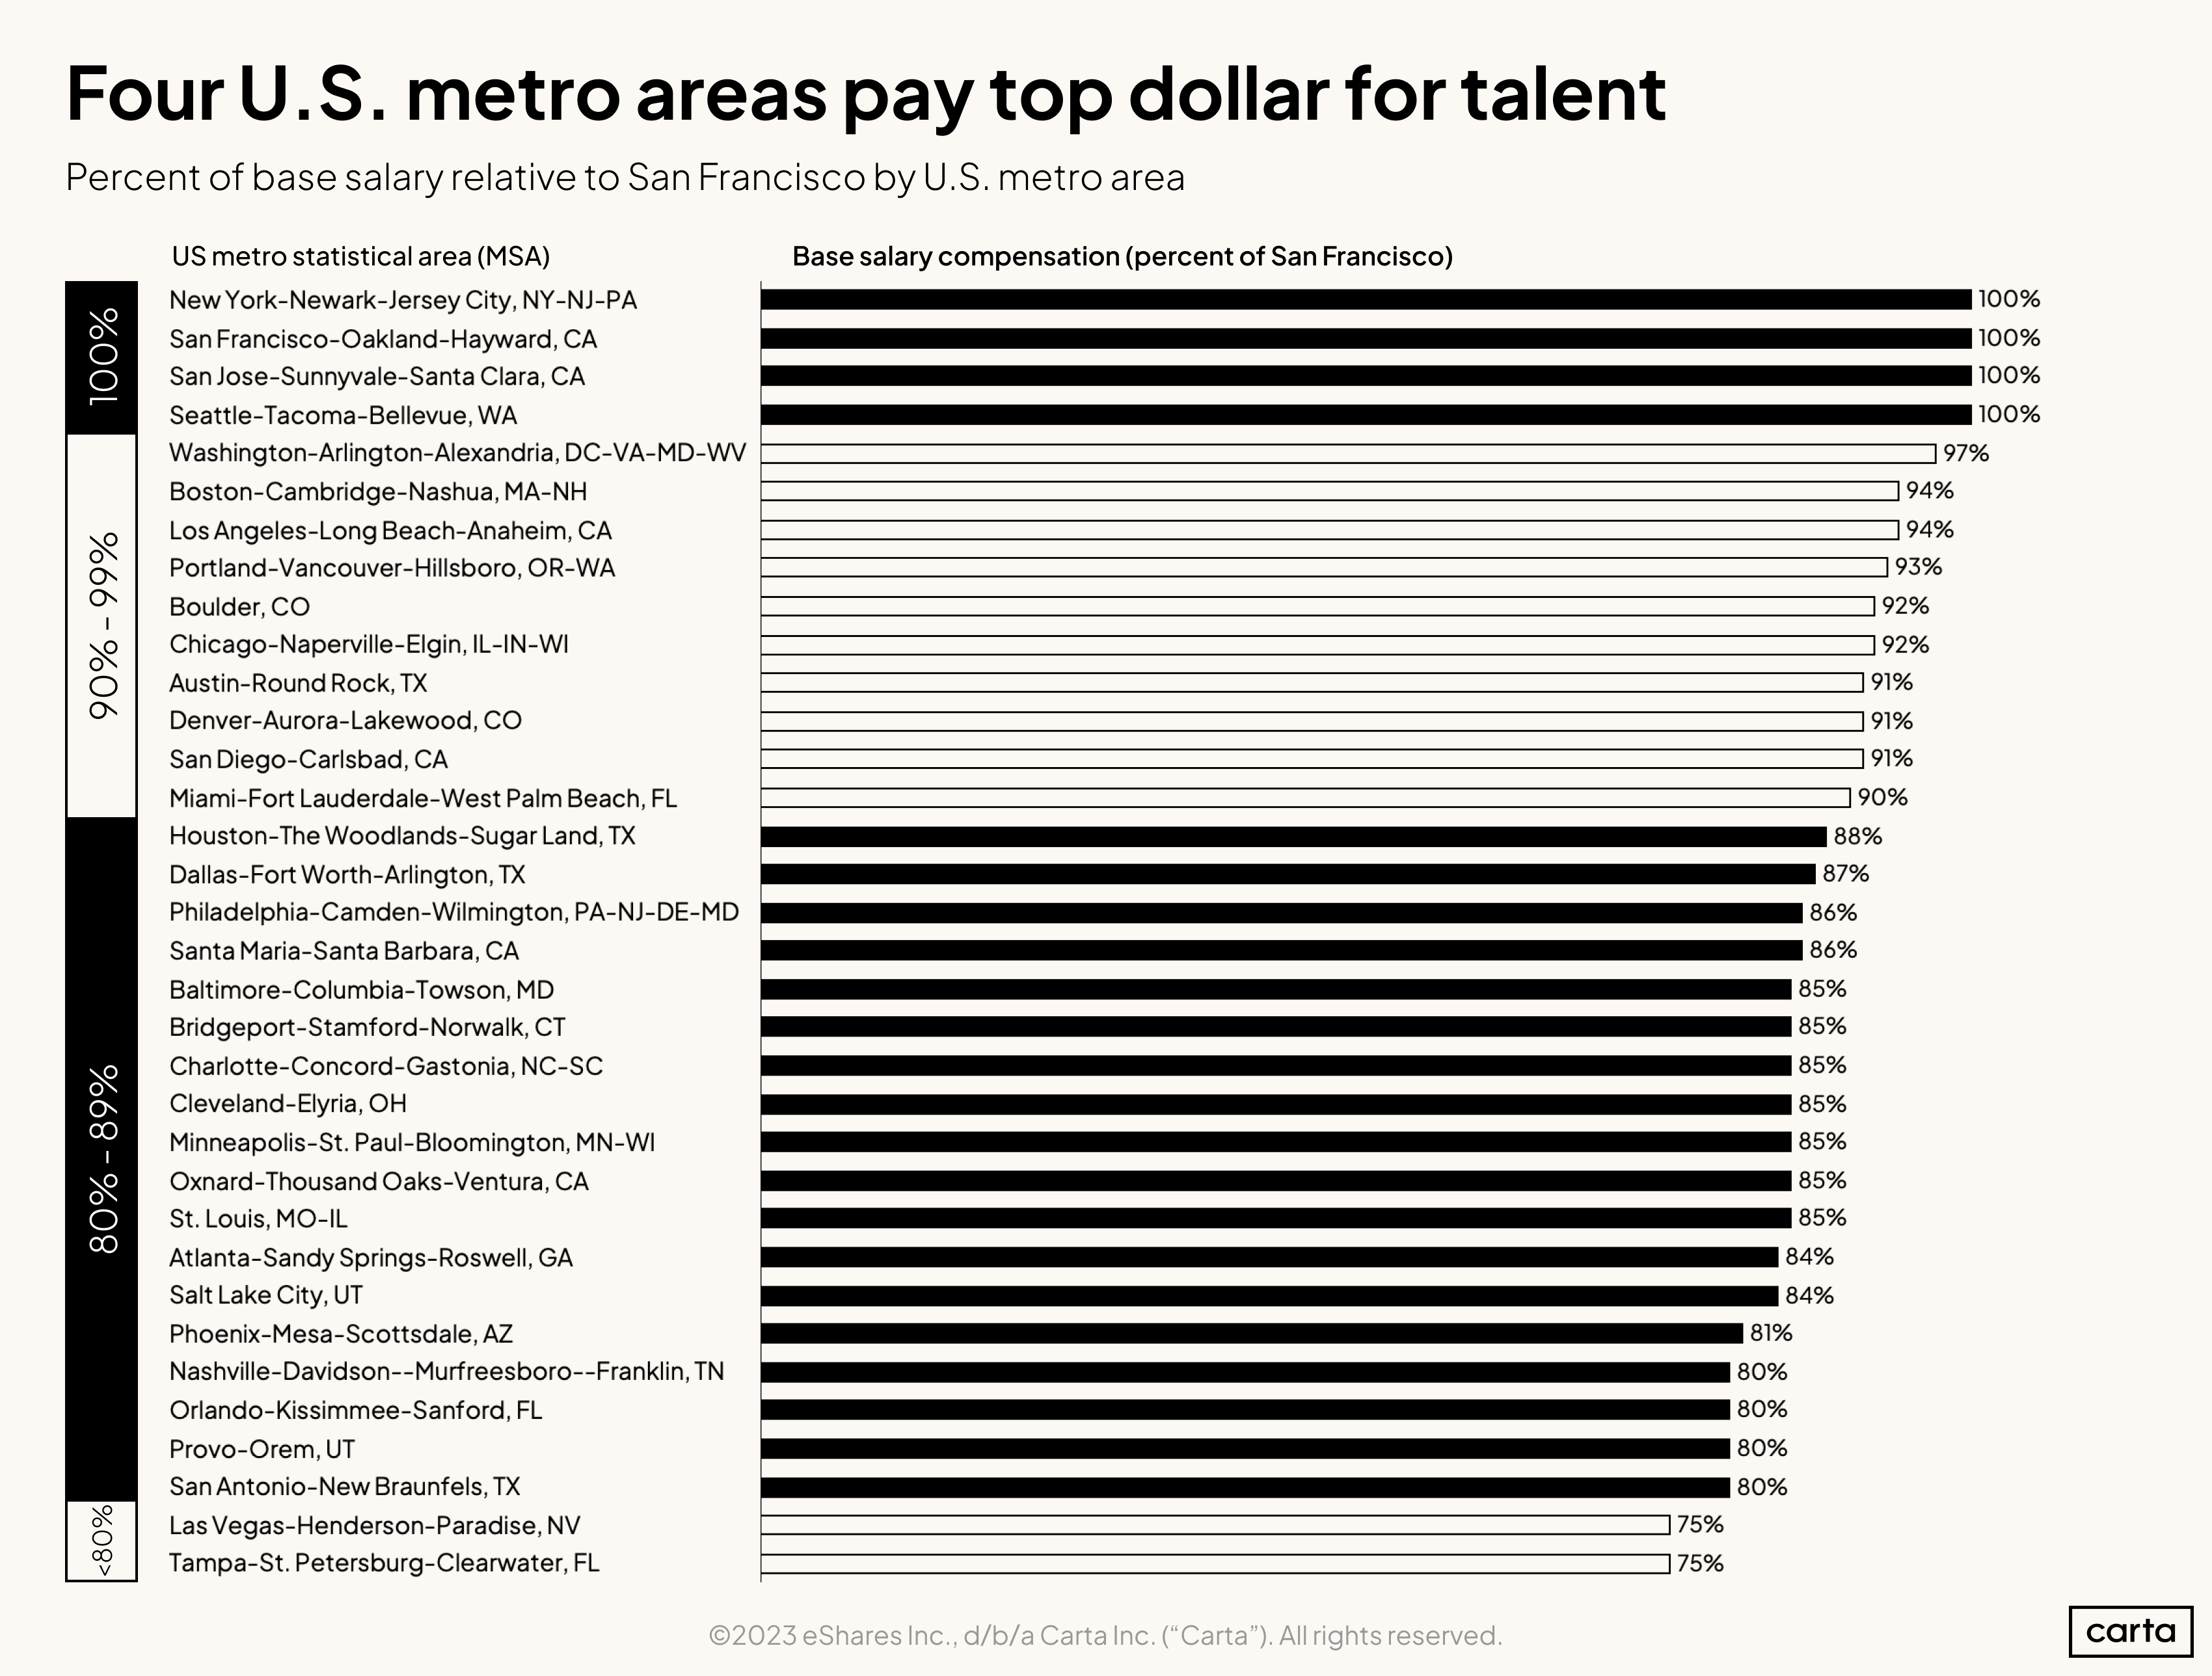
Pay differentials across top-paying startup metros
Part of the reason for pay differentials across metro areas is to account for differences in cost of living. Buying a home and raising a family in San Francisco is a more expensive endeavor than in most other cities. For the 84% of companies on Carta that adjust their compensation by location, doing so aims to tie wages to the local cost of labor and ensure that workers filling the same role in different cities are paid in a way that allows them to achieve similar standards of living.
However, even with this location-based adjustment, a startup base salary goes a lot further in some places than others. To see how closely these gaps in salary align with gaps in cost of living and local spending power, we compared San Francisco to the same 33 other metro areas across three different metrics: Median household income, median gross rent, and the Economic Policy Institute’s family budget calculator, which measures the cost of housing, food, child care, transportation, healthcare, taxes, and other necessities. (Because census data on income and rent is broken down by city, rather than metro area, we used data from the most populous city in each metro.)
We combined those three datasets into a single metric that compares cost of living and spending power in San Francisco to other cities. (Although it also measures spending power, we’ll refer to this number as “cost of living” for ease of use.) We then used this rough metric to create an index—call it the Salary-cost index, or SCI—that measures the difference between startup base salaries and cost of living for each city in the sample. The larger this SCI score, the more spending power an average startup salary provides in that city compared to San Francisco.
The findings are clear: The gaps in cost of living between San Francisco and the rest of the country are significantly larger than the gaps in salary. In other words, startup employees who live outside the Bay Area are getting more bang for their buck than workers in San Francisco.
Startup salaries vs. cost of living
The chart below ranks cities with at least 75% of San Francisco’s base salaries from least to most affordable for startup workers, using the following metrics:
% San Francisco salaries:The average percent of San Francisco salaries that startup employees receive in each metro, according to Carta Total Comp data.
% San Francisco cost of living: The average percent each metro scored in three proxies for cost of living and spending power: median household income, median gross rent, and the EPI’s family budget calculator.
SCI score: The differential between each city’s percent of San Francisco salaries and its average percent of San Francisco’s cost of living.
Metro | % SF salaries | % SF cost of living | SCI score |
San Francisco | 100% | 100% | 0 |
San Jose | 100% | 99% | 1 |
Oxnard, CA | 85% | 73% | 12 |
San Diego | 91% | 76% | 15 |
Santa Maria, CA | 86% | 70% | 16 |
Boston | 94% | 77% | 17 |
Seattle | 100% | 79% | 21 |
Tampa | 75% | 53% | 22 |
Washington, DC | 97% | 74% | 23 |
Boulder | 92% | 69% | 23 |
Las Vegas | 75% | 52% | 23 |
Nashville | 80% | 55% | 25 |
Denver | 91% | 65% | 26 |
Orlando | 80% | 54% | 26 |
Minneapolis | 85% | 58% | 27 |
Atlanta | 84% | 57% | 27 |
Phoenix | 81% | 54% | 27 |
New York | 100% | 72% | 28 |
Los Angeles | 94% | 65% | 29 |
Portland | 93% | 64% | 29 |
Charlotte | 85% | 56% | 29 |
Austin | 91% | 61% | 30 |
Bridgeport | 85% | 55% | 30 |
Salt Lake City | 84% | 53% | 31 |
San Antonio | 80% | 47% | 33 |
Philadelphia | 86% | 52% | 34 |
Baltimore | 85% | 51% | 34 |
Provo, UT | 80% | 46% | 34 |
Chicago | 92% | 56% | 36 |
Dallas | 87% | 51% | 36 |
Miami | 90% | 53% | 37 |
Houston | 88% | 48% | 40 |
St. Louis | 85% | 44% | 41 |
Cleveland | 85% | 37% | 48 |
View the underlying chart data and methodology.
How cost of living impacts startup salaries
Let’s dive into the numbers, beginning with Carta’s data on base salary. This sample includes 34 metro areas, including San Francisco. Among the other 33 regions:
Three pay 100% of the base salary of San Francisco
Ten pay between 90% and 99% of San Francisco salaries
In 31 of the 33 regions, base pay is at least 80% as high as San Francisco
The three cost-of-living and spending power metrics are much more stratified:
Just two other cities—San Jose and Seattle—have a median household income that’s 80% as high as San Francisco
Only five cities clear that 80% threshold in terms of gross rent
Only three cities are at 80% of San Francisco’s cost of living as measured by the EPI’s budget calculator
Those are stark differences. In terms of base startup salaries, 94% of metro areas are within 80% of the San Francisco market. In terms of median household income, just 6% clear the same threshold.
San Francisco vs. Chicago
Take Chicago as one example. Workers at startups in the Windy City earn 92% of the base salary as workers in similar roles in San Francisco. But the median household income in Chicago is 52% as high as in San Francisco, median gross rent is 57% as high, and the EPI’s budget calculator is 58% as high.
A worker in Chicago, then, could expect to devote a smaller portion of their salary to rent and other essentials compared to a worker in San Francisco in a similar role.
San Francisco vs. Cleveland
Or consider a more dramatic example: Cleveland. There, base salary on Carta is 85% of San Francisco levels. Yet median household income is just 27% as high as in San Francisco, median rent is at 36% of San Francisco, and the EPI says a Clevelander’s spending on essentials is 47% of a San Franciscan’s.
Salary–cost index (SCI)
The SCI offers a simple way to compare base salaries with cost of living and spending power across cities in this sample (those with at least 75% of San Francisco’s base salaries).
San Jose is the closest analog to San Francisco, with 100% of the base salary and 99% of the cost of living. Subtracting the latter from the former gives San Jose an SCI score of 1.
The next closest is Seattle, which pays 100% of the base salary of San Francisco but has 79% the cost of living. This gives Seattle an SCI score of 21.
In Chicago, base startup salaries are 92% of San Francisco levels, while the cost of living is just 56% of San Francisco’s. That gives Chicago an SCI score of 36—the fifth-highest among the cities in this sample.
Of the cities we’re tracking, Cleveland has the largest SCI score, at 48.
A few other takeaways:
Some of the largest cities in the U.S. have the largest gaps in this sample between base salary and cost of living. Chicago, Houston, Philadelphia, and Dallas all ranked in the top 10 in population in the 2020 census, and all are in the top 8 in SCI score.
Houston and Dallas are part of a larger trend in Texas. Fourteen cities in this sample have an SCI score of 30 or higher, and four of them are in the Lone Star State.
The cost of living in each of Dallas, Houston, and San Antonio is 51% or less of San Francisco.
The four cities with the lowest SCI scores in the sample are all in California: San Jose, Oxnard, San Diego, and Santa Maria.
San Jose, Oxnard, San Diego, and Santa Maria are also four of the eight cities with a cost of living at 70% or higher of San Francisco’s.
A majority of cities in this sample—20—have a cost of living less than 60% of San Francisco.
Methodology
Income and rent figures are from the U.S. Census Bureau, while the EPI—a nonprofit think tank that aims “to include the needs of low- and middle-income workers in economic policy discussions”—relies on data from multiple government agencies for its budget calculator. These three cost-of-living metrics are broken down by city, while Carta’s base salary data is broken down by metro area. For cost of living, we used the largest city within each metro area. Median household income and median rent are from the five-year span of 2017-2021, while Carta salary data is from 2022.
Learn more
Get compensation insights in your inbox
Sign up below to receive Compensation Matters, a data newsletter analyzing trends in startup compensation.

DISCLOSURE: This communication is on behalf of eShares Inc., d/b/a Carta Inc. (“Carta”). This communication is for informational purposes only, and contains general information only. Carta is not, by means of this communication, rendering accounting, business, financial, investment, legal, tax, or other professional advice or services. This publication is not a substitute for such professional advice or services nor should it be used as a basis for any decision or action that may affect your business or interests. Before making any decision or taking any action that may affect your business or interests, you should consult a qualified professional advisor. This communication is not intended as a recommendation, offer or solicitation for the purchase or sale of any security. Carta does not assume any liability for reliance on the information provided herein.
This post contains links to articles or other information that may be contained on third-party websites. The inclusion of any hyperlink is not and does not imply any endorsement, approval, investigation, or verification by Carta, and Carta does not endorse or accept responsibility for the content, or the use, of such third-party websites. Carta assumes no liability for any inaccuracies, errors or omissions in or from any data or other information provided on such third-party websites. ©2023 eShares Inc., d/b/a Carta Inc. (“Carta”). All rights reserved. Reproduction prohibited.