Overview
Much has been said about the gender pay gap, but most publicly available research focuses on only one part of compensation: salary. In 2017, women earned 80% of what men earned, according to a Pew Research Center analysis of median hourly earnings of both full and part-time workers in the United States. The gap is even larger for Black and Latina women, who earn 65% and 59% of what white men earned respectively, according to epi.org.
The gender salary gap exists in tech as well. According to Hired’s 2017 Wage Inequality Report, in the tech industry, “63% of the time, men are offered higher salaries than women for the same role at the same company. On average, these companies offer women 4% less than men for the same role, with some offering women up to 45% less.”
But this analysis is missing critical data. In startups, wealth is created through equity ownership on the cap table. A capitalization table (or “cap table”) is a list of owners of a company. It includes percentages of ownership, equity dilution, and value of equity in each round of investment. When startups do well, earnings from equity are massive, and can be significantly greater than employees’ salaries.
Carta and investment collective #Angels collaborated to analyze the Gap Table—the ownership of venture-backed companies’ equity by gender—to highlight the discrepancies in company ownership. To our knowledge, this is the most comprehensive study about the effect of gender on equity. We hope highlighting this will further the conversation about solutions to the gender compensation gap. We also hope to analyze ownership for other underrepresented groups in the future.
Summary of results

We analyzed a subset of Carta’s overall cap table data, which included nearly 180,000 employees, over 6,000 companies, and over 15,000 founders, with a combined total of nearly $45 billion in equity value.1 Of companies on Carta in our dataset:
Employee equity
-
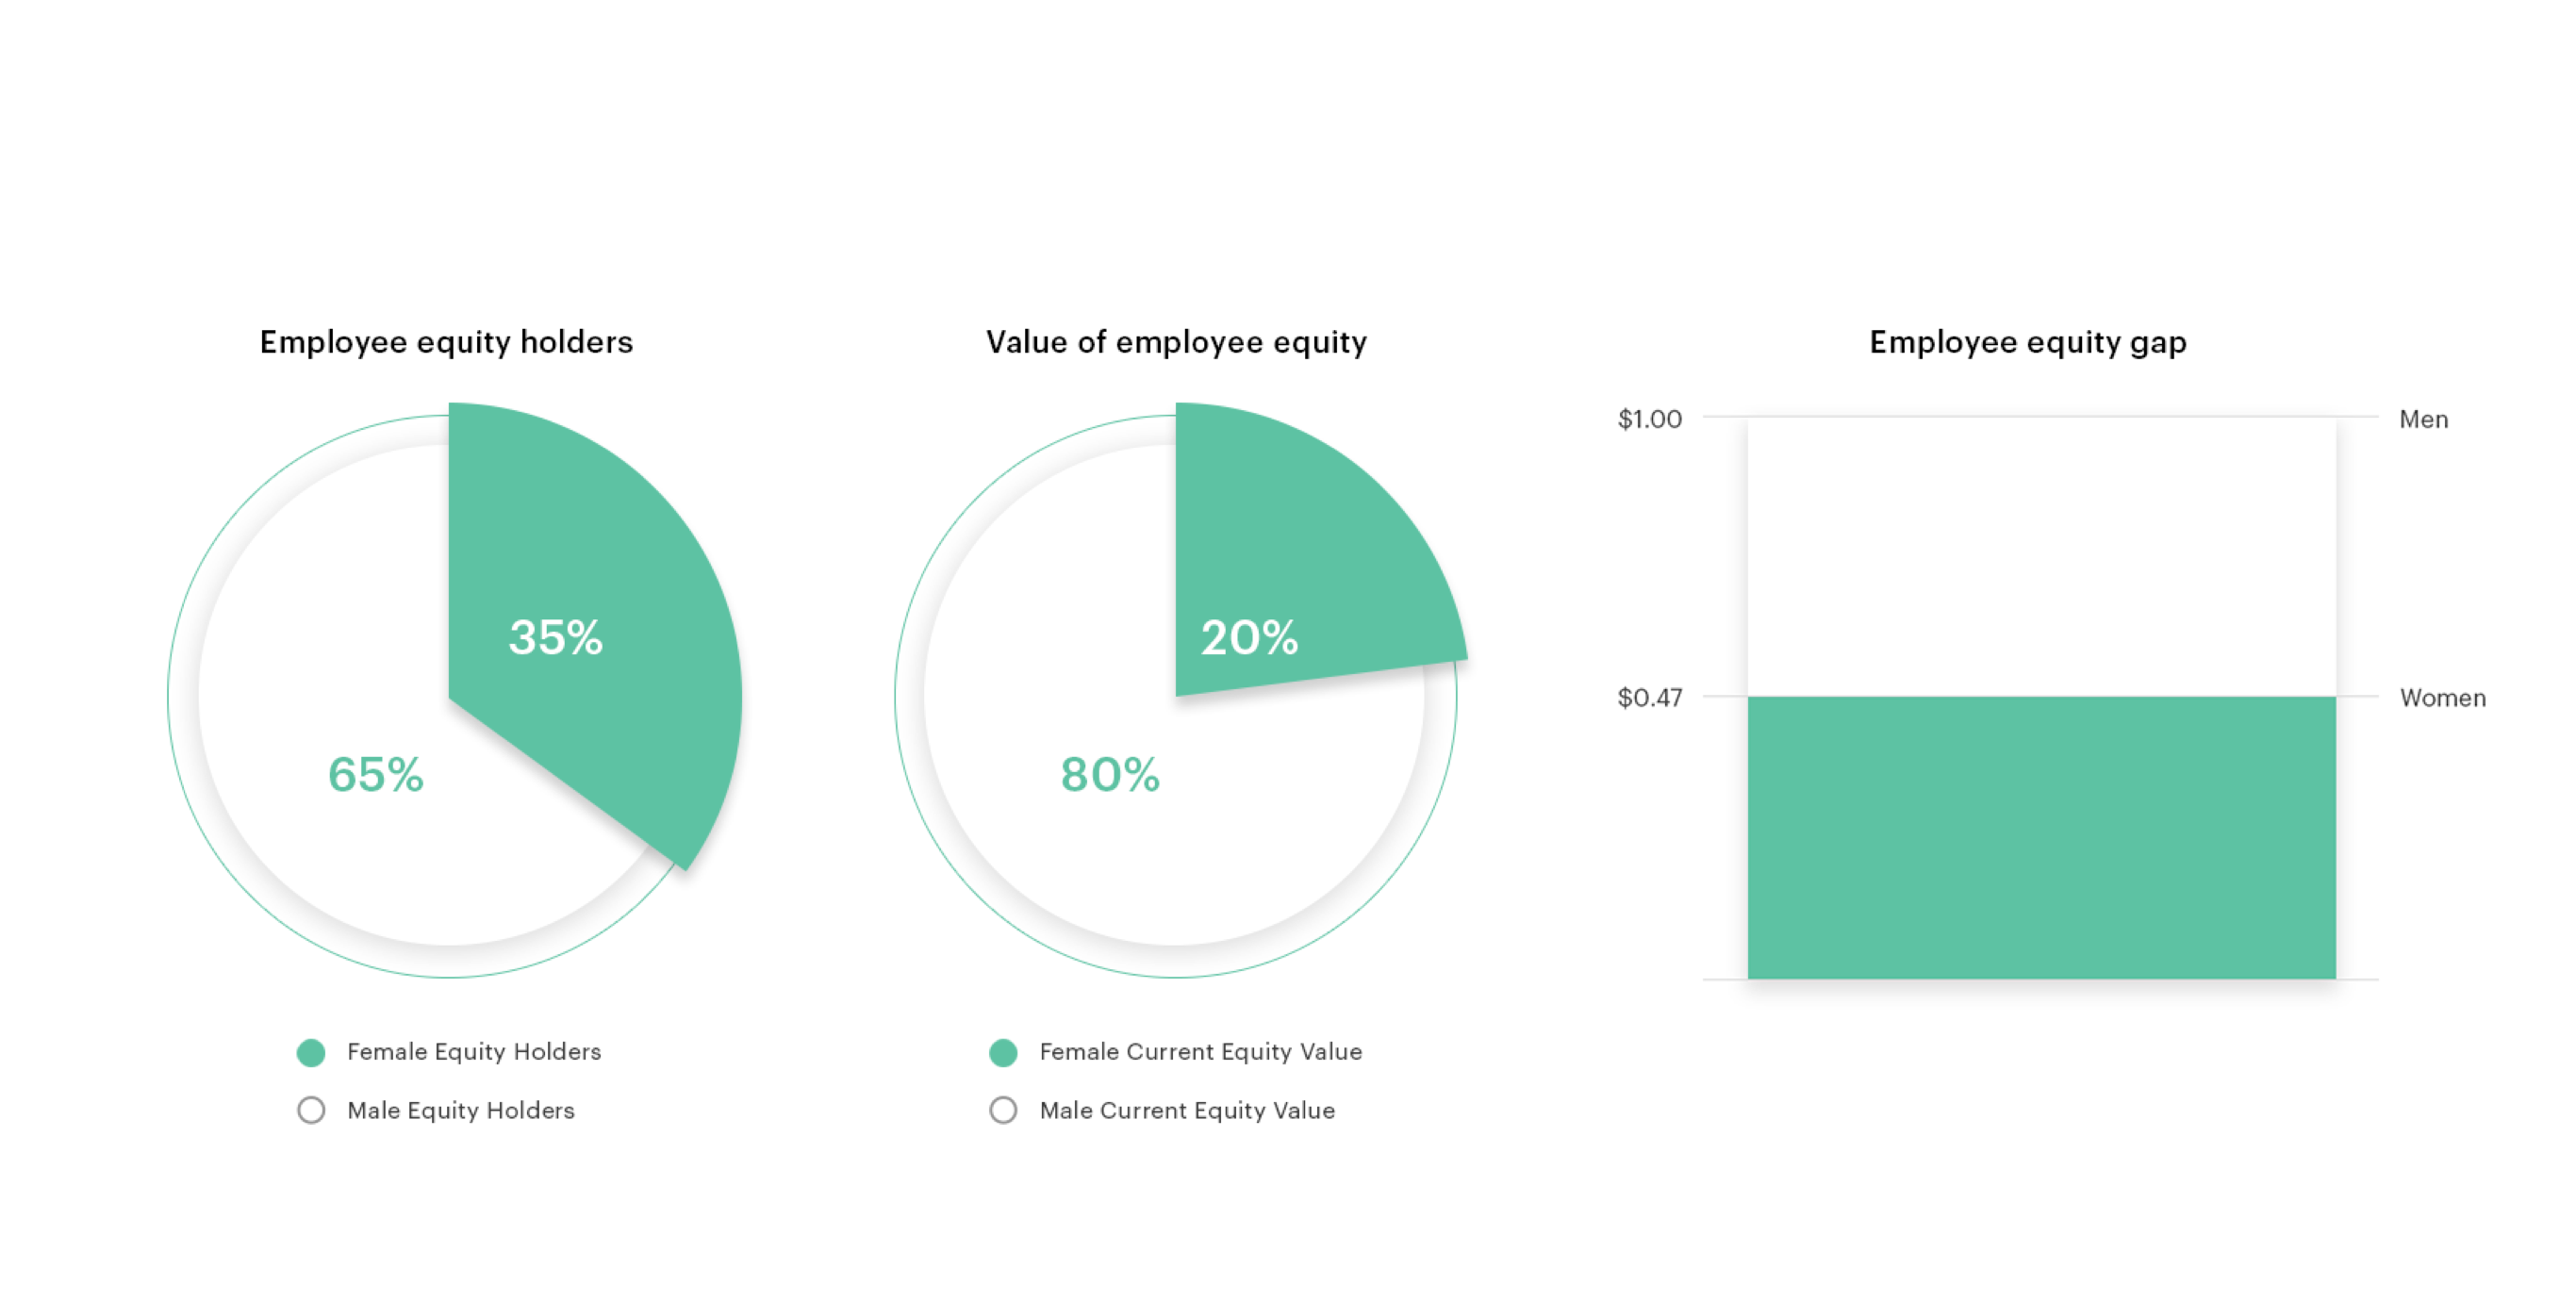
Women make up 35% of equity-holding employees, but hold only 20% of employee equity.
-
Female equity-holding employees own just 47 cents for every dollar male employees own.
-
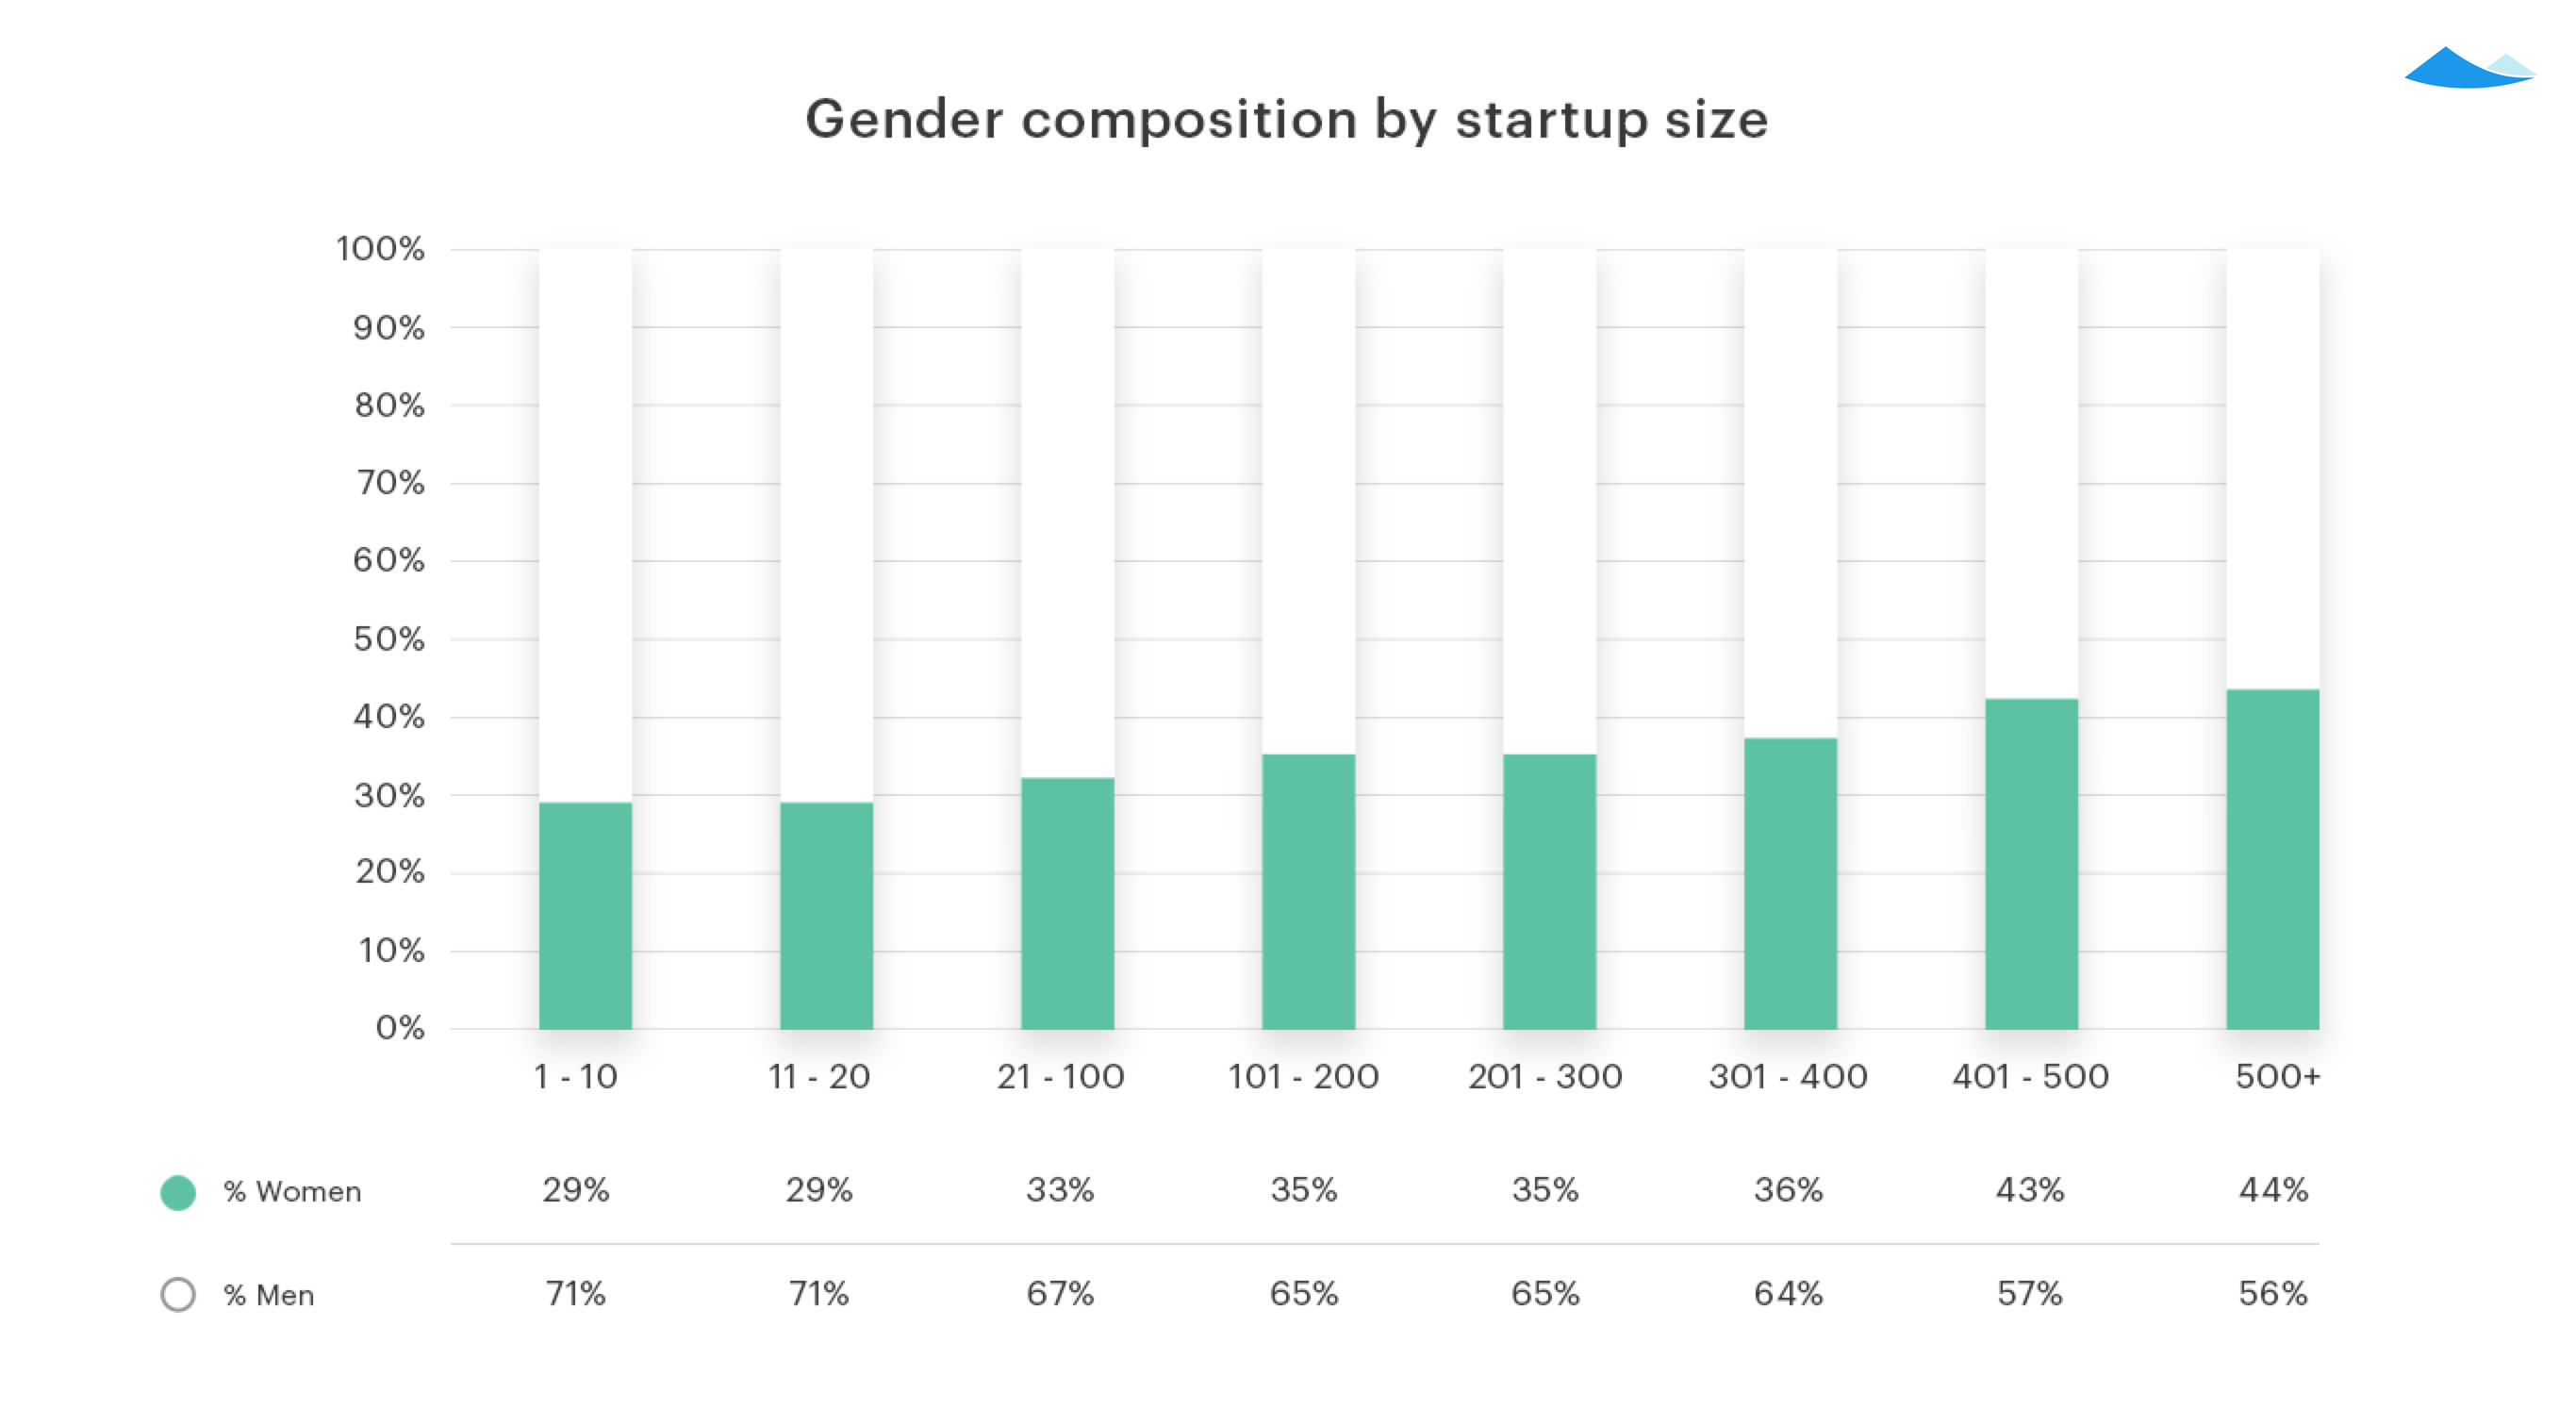
Women represent 29% of employees at companies with up to 10 employees. Female representation doesn’t exceed 40% until companies approach 400 employees.
Founder equity
-
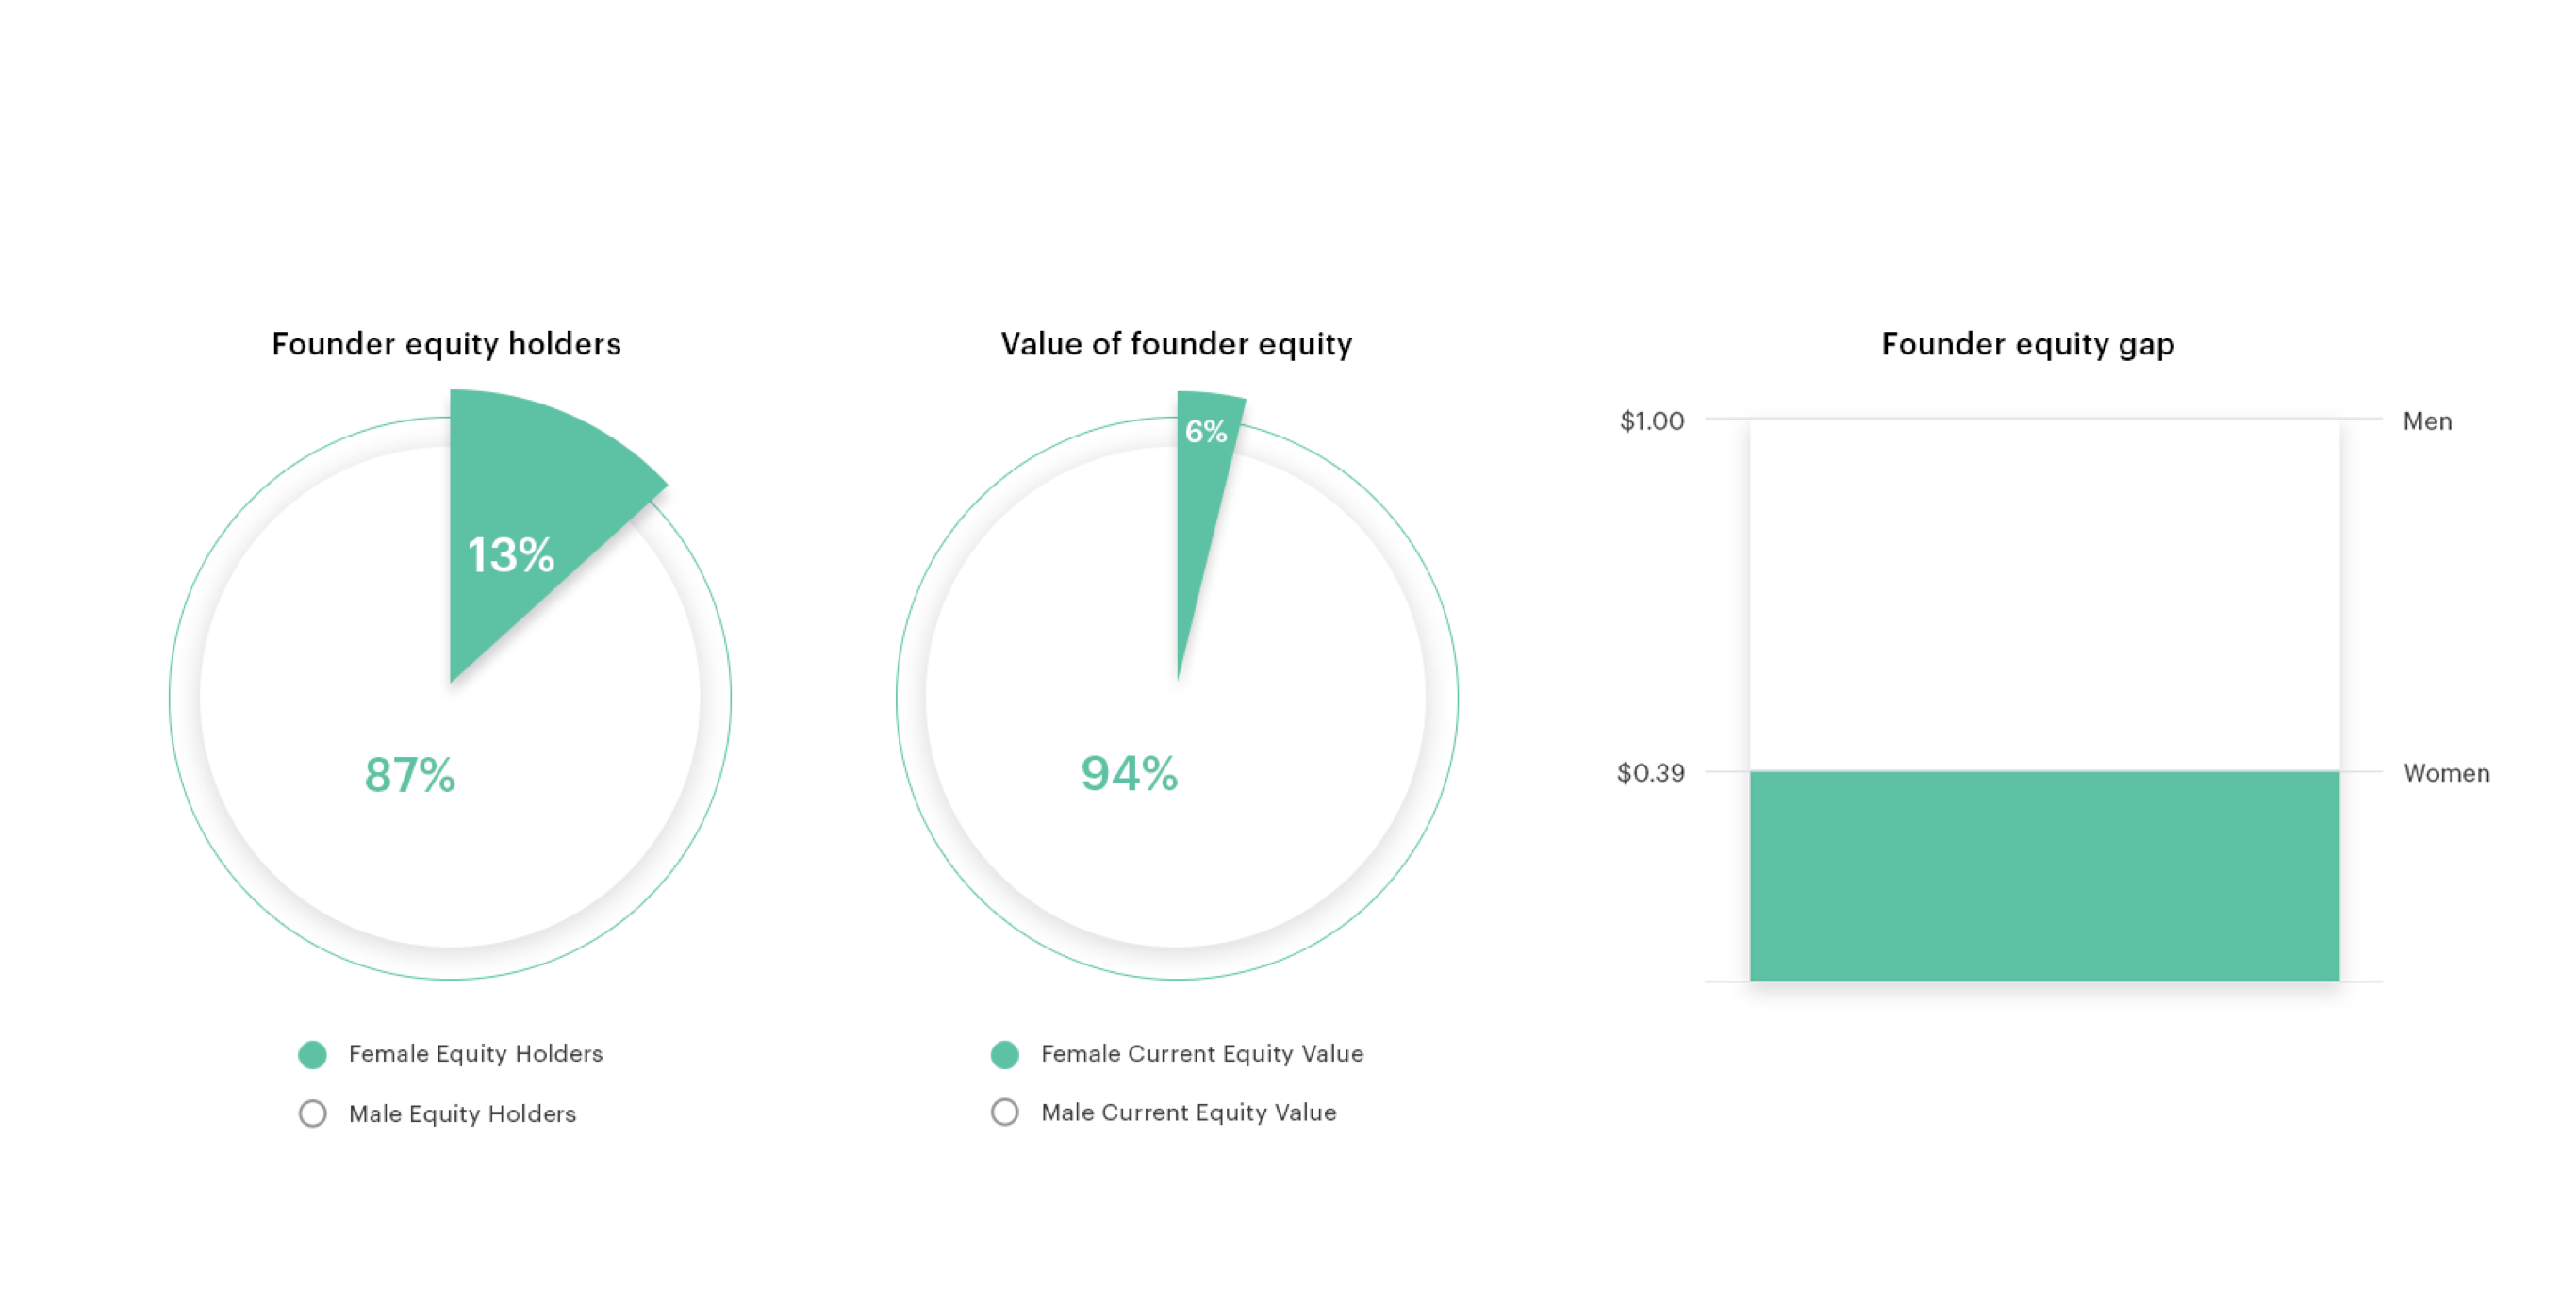
Women make up 13% of founders, but hold 6% of founder equity.
-
Female founders own just 39 cents for every dollar of equity male founders own.
The gender gap in employee equity

Looking at the breakdown by company size is also revealing. People who join at earlier stages typically receive more options at lower strike prices, which means big differences in equity value for early-stage employees compared to later-stage employees. The data shows that as companies grow, so does the percentage of female employees. Women represent 29% of employees at companies with up to 10 employees. Female representation doesn’t exceed 40% until companies approach 400 employees.
The gender gap in founder equity

Women make up 13% of founders, but own 6% of the equity held by founders.
In Carta’s study, female founders hold $1.8 billion in value, while male founders own $29.8 billion. That’s an average of $857,828 in value per female founder and $2,175,392 per male founder. This means that women who found companies own an average of just 39 cents for every dollar of equity male founders own. This is substantially worse than the gap for female employees, who own 47 cents for every dollar male employees own.
Carta’s conclusions
We believe the gender equity gap is due to a combination of a number of factors. Both Henry Ward, CEO of Carta, and #Angels have written responses to this research on their own blogs that elaborate on why and how we got to this point. We encourage you to read these posts.
This study only analyzed inferred gender and we encourage other organizations with additional data to examine race and intersectional identities, as well as self-identified gender. We hope our work catalyzes much-needed deeper explorations into narrowing the equity gap.
We also plan to make it easier for companies to collect their own data on gender and under-represented groups, so they can better analyze their cap tables. On Carta, you can add custom properties in Carta that include gender and other information about your shareholders and analyze the data in a spreadsheet.
More information
Research methodology
Carta’s platform consists of over 10,000 companies in the US, and nearly 600,000 individual shareholders in those companies.4 These shareholders include founders, board members, consultants, employees, and investors. For this analysis, we focused on employee and founder data. We included employees’ options, employees’ RSUs, and founders’ common stock, since these are the most commonly held securities by employees and founders.
To analyze the gap in employee equity, we aggregated nearly 180,000 option and Restricted Stock Unit (“RSU”) holders. We only included employees who held at least one option in our dataset, so employees who have no equity are not included.5 To calculate the value of these options, we took the current fair market value of common stock based on the last 409A valuation, subtracted the strike price per option, and multiplied by the quantity.6
For founder data, we looked at both options and common stock, which is the type of equity most frequently given to founders. Overall, we looked at 15,756 founders: 13,693 men and 2,063 women.7 To calculate the value of founder equity, we also used fair market value (FMV).
Because Carta does not currently collect gender information, we categorized names by gender using name data from the U.S. Social Security Administration.8 Using a taxonomy does have its shortcomings, but this was the most accurate and widely-used approach given our dataset:
-
While we recognize that gender is non-binary, we were only able to associate names to male and female genders.
-
We were also unable to map our cap table data to ethnicity, as Carta does not currently collect this data.
-
Using this approach approximately 13.6% of the shareholders were removed because we could not match their names. We considered first names that were less than 85% associated with one gender too ambiguous to classify.
About Carta
Carta (formerly eShares) is a software platform for founders, investors, and employees to manage equity and ownership. Founded in 2012, Carta manages hundreds of billions of dollars in equity at more than ten thousand companies, helping companies like Slack, Coinbase, Flexport, and August Capital manage their cap tables, valuations, portfolio investments, and equity plans.9 Carta’s mission is to create more owners and Carta is focused on liquidity and transparency between shareholders.
About #Angels
#Angels is an investment collective that was founded by Chloe Sladden, Jessica Verrilli, April Underwood, Katie Stanton, Vijaya Gadde, and Jana Messerschmidt in 2015. #Angels’ mission is to get more women on the cap tables of successful startups.
Glossary
-
Cap table – A capitalization table (or “cap table”) is a list of owners of a company. It includes percentages of ownership, equity dilution, and value of equity in each round of investment. Companies keep track of their cap tables in Carta, Excel, or other similar software.
-
Equity – Any security representing an ownership interest in a company. An individual has equity if they have received a security from a company.
-
Shareholder – A person or entity that owns at least one share in a company. If you are a shareholder you have equity.
-
Options – The right to buy stock at a set price, the strike price, in a certain period of time. Common stock – A common form of equity compensation for startup employees and founders. Typically, when you exercise employee options they turn into common stock.
-
RSU – A Restricted Stock Unit is common stock to be delivered at a future date, contingent on vesting and performance conditions. Unlike options, you don’t have to buy RSUs.
-
Strike price – the price at which an option can be exercised. For private company options, this is set using the FMV set by a 409A Valuation.
-
FMV – A 409A valuation sets the fair market value (FMV) of common stock, which determines the strike price for equity.
-
409A valuation – an independent appraisal of the FMV of a private company’s common stock. A 409A is required by IRS Section 409A and if a company offers options, they need a 409A valuation.
Footnotes
1 Companies who have contractually requested that we not use their data in anonymized and aggregated studies are not included in this analysis.
2 Women average current equity value per capita / men average current equity value per capita.
3 Please note that the population of employees analyzed includes all employees with at least one option. If an employee is not granted any options, that employee would not be included in this analysis.
4 The distribution of cap tables on Carta skews towards early-stage venture backed startups. The average number of employees with equity grants per company in our dataset is 38, and the median is 13. The average age of company in our dataset is 4.82 years while the median is 4.06 years.
5 We also excluded options that did not have an updated fair market value since the time of the grant.
6 For employees, we subtracted strike price to calculate total value. But for common stock, there is no strike price, so we did not subtract.
7 We included shareholders labelled “founder” in Carta and shareholders who were issued common stock prior to the first preferred equity round. We removed ambiguous shareholders if we could not determine if they were a founder.
8 To keep data anonymized, we classified gender using first names independently from equity data and then used this table to classify gender without any identifying information.
9 We are not disclosing the names of companies in our study. Inclusion in this list does not imply that these companies were included in the analysis
10 Women own 9% of equity, men own the other 91%.
